

Download the 6.27.25 Dynamic Market Update for advisors’ use with clients
By Kostya Etus, CFA®, Chief Investment Officer, Dynamic Asset Management
What’s the definition of a resilient market? Perhaps one that maintains momentum amid fear of a potential war brewing in the Middle East. The market (as measured by S&P 500) maintains its upward trajectory since the April lows with more than a 4% gain on the year (through June 24). Bonds are not far behind with more than a 3% return, but international markets continue to be standout winners this year with almost a 17% return. Overall, it has been a strong year for diversified portfolios.
Recent market performance has been driven less by geopolitics and more by expectations from the Federal Reserve (Fed). While they held interest rates unchanged at last week’s meeting, as expected, investors were more interested in the Fed’s forecasts in the following key categories:
- Change in Real GDP. The Fed forecast for inflation-adjusted economic growth in 2025 was revised down 1.4% from last quarter’s 1.7%. This is in line with expectations of a cooling economy as we follow three years of above average growth (over 2.0%). That said, the Fed expects reacceleration of growth in the next two years.
- Unemployment Rate. Expectations for 2025 unemployment rate were nudged higher to 4.5% (from 4.4%). This aligns with the weaker growth forecast but remains at a relatively low level, meaning a healthy labor market, when compared to recessionary periods.
- PCE Inflation. The Fed’s preferred inflation gauge, Core Personal Consumption Expenditure (PCE) Price Index, was elevated from 2.8% to 3.1% for the 2025 forecast. This increase was largely driven by tariffs, although a lot of uncertainty remains around the full impact to consumer prices. While this increase may be most concerning to investors hoping for more rate cuts, the Fed expects inflation to grind closer to their 2.0% target in the next couple years.
BONUS: The Dot Plot. Perhaps the most anticipated component of the Fed projections is their expectations for interest rate cuts moving forward, often referred to as the dot plot. The 2025 forecast remained unchanged with two rate cuts expected in the second half of the year, matching market expectations. Unfortunately, only one cut is expected in 2026 and another in 2027, implying a shallower path than previously expected. That said, their “long-run” target remains at 3.0%.
The Fed will be in a tough spot in the second half of the year based on expectations of higher inflation and slower growth. We could see a more cautious approach to interest rate policy than we have in the past. That said, it doesn’t mean the easing cycle is over. Interest rates remain elevated, and the Fed remains accommodative; they won’t hesitate to lower rates as needed to boost the economy and any weakness in the labor market.
International Markets Historic Rebound
As mentioned, international markets have been the investment darlings of 2025 with their standout performance relative to the U.S. There are a few things which have been attributed to this rotation, including 1) relative earnings growth improvement abroad 2) attractive valuations of non-U.S. companies and 3) international currencies strengthening versus the U.S. Dollar.
But how rare is this occurrence of international outperformance? And could it be here to stay? Let’s explore some historic data to help us find the answers:
- It’s Been a While. Perhaps the best explanation for everyone’s surprise to this year’s international run is due to “recency bias.” After all, it’s been almost a decade since international markets have shown any meaningful outperformance. Much of this can be attributed to U.S. dollar strength post the Financial Crisis. But as we know, currencies are one of the more cyclical investments and tend to revert to the average over time.
- Magnitude and Length. The other interesting component of the recent outperformance is that it’s by the largest difference in over 30 years! Now this magnitude of outperformance may not persist, but what history has shown us is that when international markets start to outperform by wider margins, it tends to last for multiple years.
- Diversification is Key. The most important aspect of the chart below is that both U.S. and international markets have outperformed the same number of years (28 years each) and average annualized returns for each asset class have been about the same (between 8.5% and 9.5%). Nobody knows what the future will bring, and which asset class will outperform next. However, we can control staying diversified by investing in a wide range of asset classes to help avoid any significant swings in portfolio returns and be in a better position to meet our long-term investment goals.
Stay diversified, my friends.
International vs. Domestic Returns
MSCI EAFE – MSCI U.S. Total Return Annual Difference Since 1970
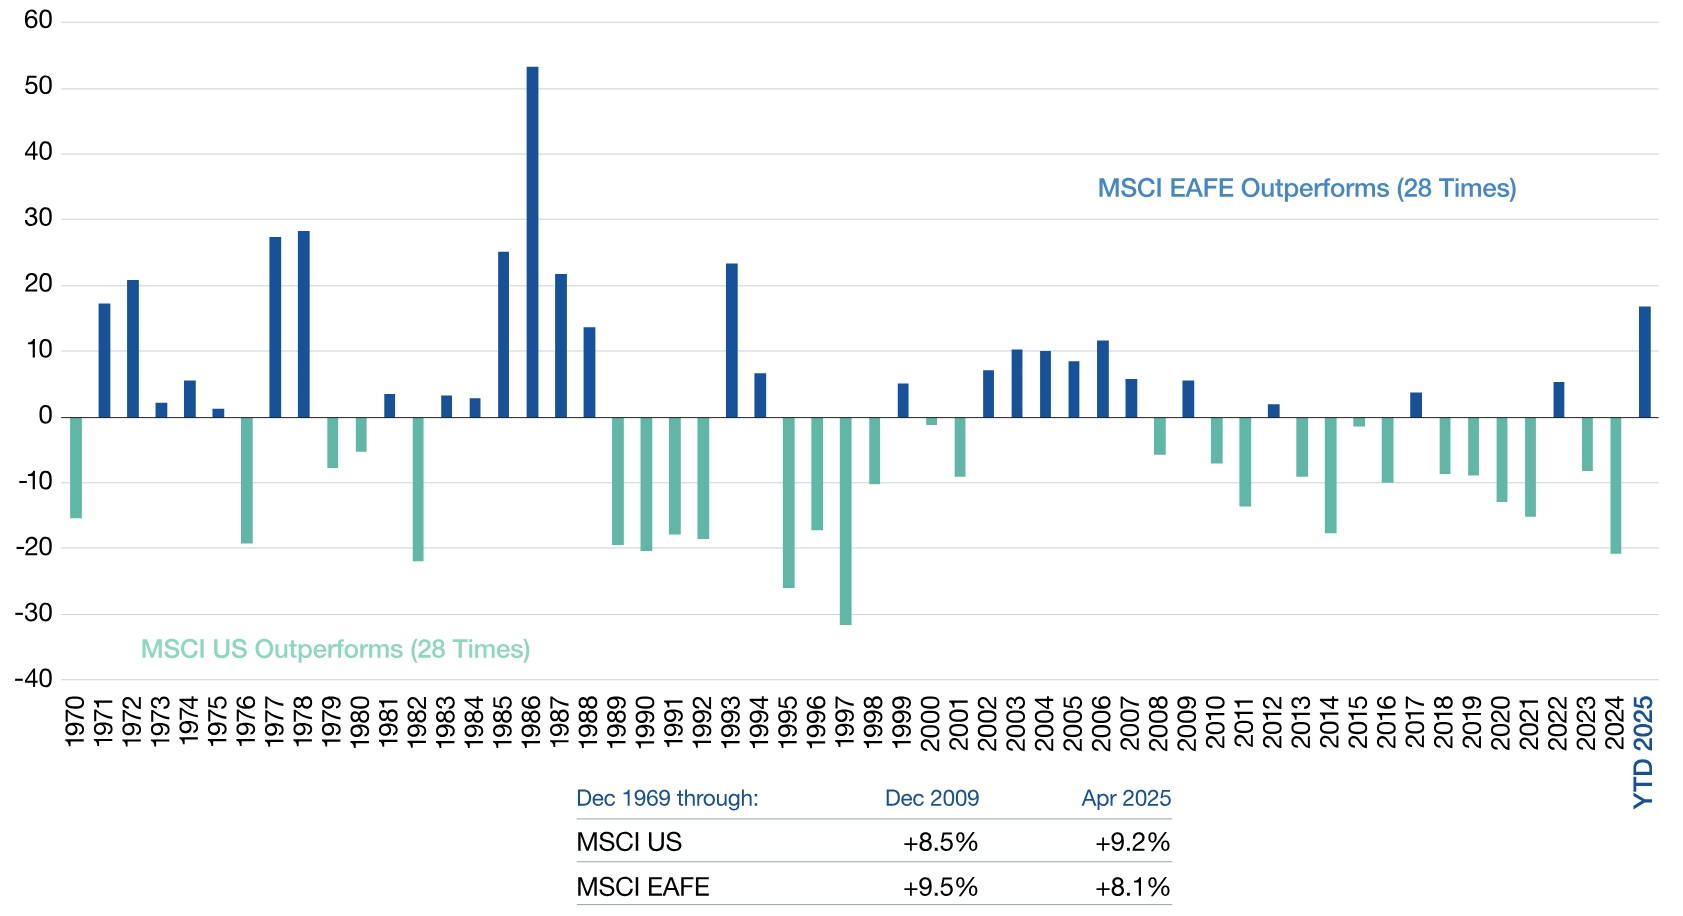
Source: Lazard, MSCI. As of April 30, 2025. Returns since 1969 are annualized. The performance quoted represents past performance. Past performance is not a reliable indicator of future results. This information is for illustrative purposes only and does not represent any product or strategy managed by Lazard. It is not possible to invest directly in an index.
As always, Dynamic recommends staying balanced, diversified and invested. Despite short-term market pullbacks, it’s more important than ever to focus on the long-term, improving the chances for investors to reach their goals.
Should you need help navigating client concerns, don’t hesitate to reach out to Dynamic’s Asset Management team at (877) 257-3840, ext. 4 or investmentmanagement@dynamicadvisorsolutions.com.
Disclosures
This commentary is provided for informational and educational purposes only. The information, analysis and opinions expressed herein reflect our judgment and opinions as of the date of writing and are subject to change at any time without notice. This is not intended to be used as a general guide to investing, or as a source of any specific recommendation, and it makes no implied or expressed recommendations concerning the manner in which clients’ accounts should or would be handled, as appropriate strategies depend on the client’s specific objectives.
This commentary is not intended to constitute legal, tax, securities or investment advice or a recommended course of action in any given situation. Investors should not assume that investments in any security, asset class, sector, market, or strategy discussed herein will be profitable and no representations are made that clients will be able to achieve a certain level of performance, or avoid loss.
All investments carry a certain risk and there is no assurance that an investment will provide positive performance over any period of time. Information obtained from third party resources are believed to be reliable but not guaranteed as to its accuracy or reliability. These materials do not purport to contain all the relevant information that investors may wish to consider in making investment decisions and is not intended to be a substitute for exercising independent judgment. Any statements regarding future events constitute only subjective views or beliefs, are not guarantees or projections of performance, should not be relied on, are subject to change due to a variety of factors, including fluctuating market conditions, and involve inherent risks and uncertainties, both general and specific, many of which cannot be predicted or quantified and are beyond our control. Future results could differ materially and no assurance is given that these statements or assumptions are now or will prove to be accurate or complete in any way.
Past performance is not a guarantee or a reliable indicator of future results. Investing in the markets is subject to certain risks including market, interest rate, issuer, credit and inflation risk; investments may be worth more or less than the original cost when redeemed.
Investment advisory services are offered through Dynamic Advisor Solutions, LLC, dba Dynamic Wealth Advisors, an SEC registered investment advisor.
Photo: Adobe Stock