

Download the 09.19.25 Dynamic Market Update for advisors’ use with clients
By Kostya Etus, CFA®, Chief Investment Officer, Dynamic Asset Management
The markets continue to grind higher with the S&P 500 up more than 13% on the year (through Sept. 16, 2025), while international markets continue their dominance with over a 26% return over the same period. Even bonds are up close to 7%, boosting balanced and diversified portfolios. Recent market performance has been largely driven by expectations of the first interest rate cut of 2025, and the Federal Reserve (Fed) didn’t disappoint. On Wednesday, the Fed cut rates by 0.25% to a range of 4–4.25%, the lowest rate in nearly three years.
More importantly the Fed released their highly anticipated “dot plot” which shows expectations for future cuts. The biggest takeaway was an expected acceleration of the timing of cuts, with two more expected this year (potentially at the two remaining meetings in October and December). Additionally, the expectation for next year was reduced to only one cut, as well as only one cut in 2027.
These expectations provide a unique mix of dovishness (more easing in the short term) and hawkishness (less easing over the longer term) and the markets exhibited this confusion with heightened volatility throughout the day of the announcement. But let’s remember that expectations can change and we know that the Fed is very data dependent. Meaning that the Fed will rely on inflation and employment data to determine the best decisions to make at each meeting, and it certainly will not be politically charged as recent media headlines would lead you to believe.
Case in point, let’s review the recent economic data which led to the rate cut decision:
- Inflation. The latest consumer price index (CPI) report showed inflation largely in line with expectations at a 2.9% annualized growth rate for August. While this was a slight increase from the previous month, attention was more drawn to the producer price index (PPI) to see if tariffs were starting to impact sellers. And this is where the big surprise happened, PPI inflation fell to 2.6% annualized for August, well below the estimated 3.3%. This is the key input that the Fed was looking for, clarity on how tariffs may be impacting inflations, and this reading may have put their minds at ease.
- Employment. As a reminder, the Fed has a dual mandate: 1) Stable Prices, i.e., low inflation and 2) Maximize Employment, i.e., low unemployment. With inflation stable, there’s only one side of the coin to worry about. The U.S. Bureau of Labor Statistics released its quarterly census of employment and wages showing more than 900,000 fewer jobs were created over the previous year than previously reported. Meaning initial employment reports were overestimating job growth and this could be a representation of a more meaningful slowdown in the economy. This is essentially the data point which locked in the September rate cut.
Despite mixed expectations for the speed and number of cuts over the next few years, the main thing to consider is there will be cuts, period. Meaning the Fed is still in easing mode for the foreseeable future, which is particularly important for the stock market, which continues to notch record highs with elevated valuations. Ultimately, lower rates make borrowing cheaper, supporting the economy and corporate profits.
Don’t Count Out the Little Guy
One interesting market observation since the “rate cut rhetoric” started around the start of the third quarter is that small-cap stocks started to outperform large-caps. The last few years have not been kind to smaller companies as elevated interest rates have made it difficult for them to source debt. This has been exacerbated by the AI boom with mega-cap growth companies, often referred to as the “Magnificent 7” stealing all the spotlight.
But with large growth companies trading at nosebleed valuations and the Fed starting to cut rates, could this be the time for a much-awaited market performance rotation into smalls? Dimensional Fund Advisors (DFA) helps us make an evaluation of what we could expect at current valuations based on a historic comparison of large-cap and small-cap returns. Let’s look at the key observations:
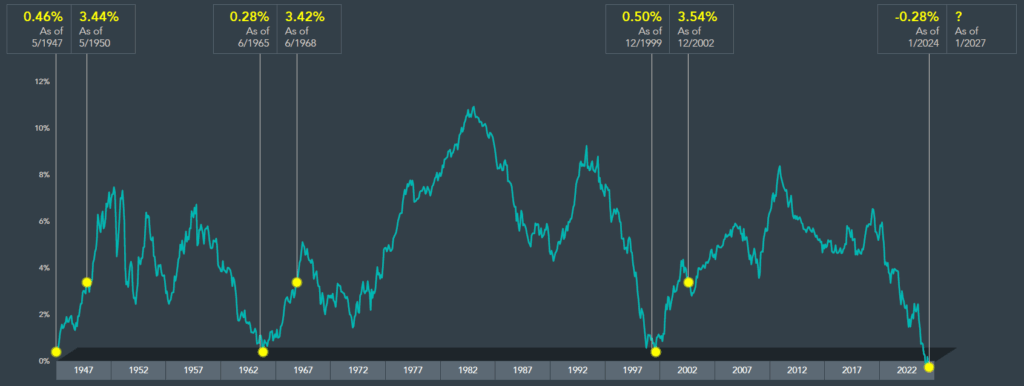
- Cyclicality. One important market concept to keep in mind is that markets are cyclical. This is true for asset classes, sectors, countries, and even individual companies. And the thesis makes intuitive sense as no one investment can consistently outperform; eventually it reaches an elevated price and comes back down while beaten up investments rebound. You can easily see this in the chart below as the line cycles over time through mountain peaks and valley troughs.
- Valuation. The chart below shows when small-cap stocks underperform large-caps to the point of neutrality (0% level in the graph), there is often a strong short-term reversal (small-caps outperform over the following three-year periods). We reached that neutrality in 2024, something like what we last saw at the end of 1999 (right before the tech bubble burst). What followed that time was a strong bout of small-cap outperformance. Nobody has a crystal ball, but current valuations would suggest the probabilities are in favor of smaller stocks.
- Diversification. While cyclicality and valuations can help guide performance, nobody really knows what the markets will do or when. This is why it’s always important to stay well diversified among a variety of asset classes which help offset each other, depending on market environment. The result is a smoother ride over the long term, more stable returns, and a higher likelihood of staying invested for the long-term. Ultimately resulting in higher chances to reach investor long-term financial goals.
Stay diversified, my friends.
Large-Cap vs. Small-Cap Return Cycles
20-year rolling return difference between Dimensional U.S. Small Cap Value Index and S&P 500 Index
May 1947–January 2024
Sources: Dimensional Fund Advisors publication “Sticking Up for Small Value Stocks” by Wes Crill, PhD, May, 1, 2024. Past performance is no guarantee of future results. Actual returns may be lower. The Dimensional indices represent academic concepts that may be used in portfolio construction and are not available for direct investment or for use as a benchmark. Index returns are not representative of actual portfolios and do not reflect costs and fees associated with an actual investment. See “Index Descriptions” for descriptions of the Dimensional index data. S&P data © 2024 S&P Dow Jones Indices LLC, a division of S&P Global. All rights reserved. Past performance is not a guarantee of results.
As always, Dynamic recommends staying balanced, diversified and invested. Despite short-term market pullbacks, it’s more important than ever to focus on the long-term, improving the chances for investors to reach their goals.
Should you need help navigating client concerns, don’t hesitate to reach out to Dynamic’s Asset Management team at (877) 257-3840, ext. 4 or investmentmanagement@dynamicadvisorsolutions.com.
Disclosures
This commentary is provided for informational and educational purposes only. The information, analysis and opinions expressed herein reflect our judgment and opinions as of the date of writing and are subject to change at any time without notice. This is not intended to be used as a general guide to investing, or as a source of any specific recommendation, and it makes no implied or expressed recommendations concerning the manner in which clients’ accounts should or would be handled, as appropriate strategies depend on the client’s specific objectives.
This commentary is not intended to constitute legal, tax, securities or investment advice or a recommended course of action in any given situation. Investors should not assume that investments in any security, asset class, sector, market, or strategy discussed herein will be profitable and no representations are made that clients will be able to achieve a certain level of performance, or avoid loss.
All investments carry a certain risk and there is no assurance that an investment will provide positive performance over any period of time. Information obtained from third party resources are believed to be reliable but not guaranteed as to its accuracy or reliability. These materials do not purport to contain all the relevant information that investors may wish to consider in making investment decisions and is not intended to be a substitute for exercising independent judgment. Any statements regarding future events constitute only subjective views or beliefs, are not guarantees or projections of performance, should not be relied on, are subject to change due to a variety of factors, including fluctuating market conditions, and involve inherent risks and uncertainties, both general and specific, many of which cannot be predicted or quantified and are beyond our control. Future results could differ materially and no assurance is given that these statements or assumptions are now or will prove to be accurate or complete in any way.
Past performance is not a guarantee or a reliable indicator of future results. Investing in the markets is subject to certain risks including market, interest rate, issuer, credit and inflation risk; investments may be worth more or less than the original cost when redeemed.
Investment advisory services are offered through Dynamic Advisor Solutions, LLC, dba Dynamic Wealth Advisors, an SEC registered investment advisor. Photo: Adobe Stock