

Download the Q3 2025 Investing Insights for advisors’ use with clients
By Kostya Etus, CFA®
Chief Investment Officer, Dynamic Asset Management
“If you ain’t first, you’re last.”
– Ricky Bobby (Will Ferrell),“Talladega Nights: The Ballad of Ricky Bobby,” 2006
Market Review
We had some dark clouds appear in the third quarter as weak employment readings signaled the economy may not be as solid as investors believed. But silver linings prevailed as the prospects of a weakening job market drove the Federal Reserve (Fed) to give us our first interest rate cut of the year. This provided a runway to the stock market, bond market and real estate to continue to grind higher in the third quarter.
Looking at year-to-date performance through the third quarter, global markets are on pace to beat last year’s stellar figures. But unlike last year, international markets continue to be the primary drivers of returns in 2025. But they’re not the only winners we may be seeing. As interest rates fell, we have also seen small-cap stocks outperforming their larger counterparts in the third quarter. This trend may continue as the Fed maintains its accommodative stance.
Here are the key economic data points which have supported the market in the third quarter and could extend the rally through year end:
- GDP Growth. The final estimate for second quarter’s Gross Domestic Product (GDP) growth, the primary gauge of the health of the U.S. economy, was revised higher at the end of September to a strong 3.8% annualized rate, well above estimates of 3.3%. After stalling in the first quarter due to tariff fears, it appears the economy is back on track, and then some. Early expectations for third quarter indicate the economy has continued to grow by more than 3%.
- Job Market. While job growth has come in below expectations for the last couple months, it is reassuring and it remains positive, as measured by U.S. non-farm payrolls. And while there was a significant downward revision over the past year reported by the Bureau of Labor Statistics, we have not seen a meaningful uptick in the unemployment rate, which remains at a historically low 4.3%.
- Inflation Rate. Personal Consumption Expenditures (PCE), the Fed’s preferred inflation gauge, came in at 2.7% for August, in line with expectations. Likewise, core PCE, which excludes the more volatile food and energy prices, rose by 2.9%, also matching expectations. While these rates are elevated relative to the Fed’s 2% target, they remain below their recent estimates, and the impact of tariffs may have been exaggerated.
While we may be seeing a softening of the labor market and slightly elevated inflation, it appears the economy remains resilient on the back of a healthy consumer and the continued support of the Fed. And as we head into the holiday months, we could see continued support from shoppers as well as the expectations of a holiday gift from the Fed in the form of an additional interest rate cut. Given that lower interest rates help boost spending by companies and consumers alike, we could see continued strength for the markets in the fourth quarter, and beyond.
Key takeaways from the chart below:
- International markets have been standout performers in 2025. Can they maintain the lead?
- Small companies have been falling behind, but is there a momentum shift on the horizon?
- Bonds have had a lackluster few years, but do they still have a role to play?
Asset Class Returns through Q3 2025
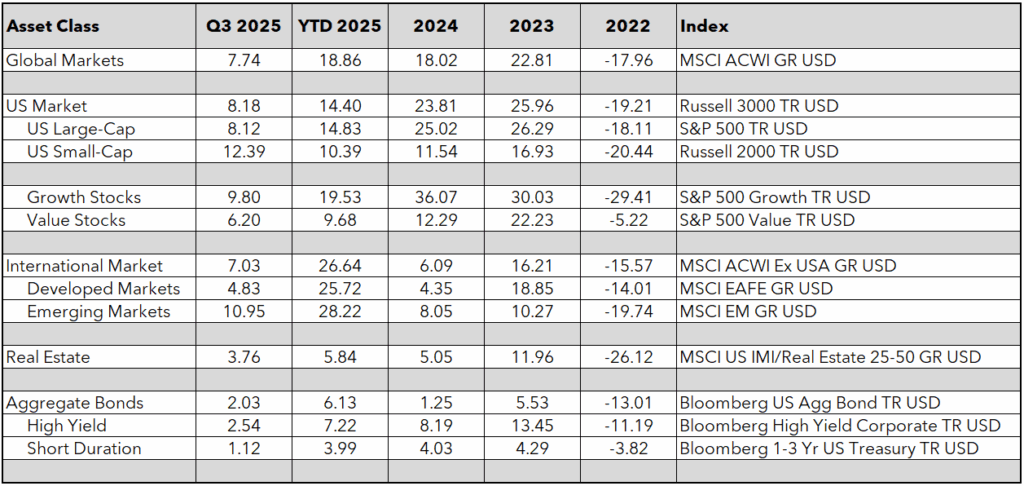
Source: Morningstar Direct as of Sept. 30, 2025. Past performance does not guarantee or indicate future results.
1. U.S. vs. International
As mentioned above, international markets have been the investment darlings of 2025, with their standout performance relative to the U.S. There are a few things which have been attributed to this rotation, including 1) relative earnings growth improvement abroad 2) attractive valuations of non-U.S. companies, and 3) international currencies strengthening versus the U.S. dollar.
But how rare is this occurrence of international outperformance? And could it be here to stay? Let’s explore some historic data to help us find the answers:
- It’s Been a While. Perhaps the best explanation for everyone’s surprise to this year’s international run is due to “recency bias.” Afterall, it’s been almost a decade since international markets have shown any meaningful outperformance. Much of this can be attributed to U.S. dollar strength post the financial crisis. But as we know, currencies are one of the more cyclical investments and tend to revert to the average over time.
- Magnitude and Length. The other interesting component of the recent outperformance is that it’s by the largest difference in more than 30 years! This magnitude of outperformance may not persist, but what history has shown is that when international markets start to outperform by wider margins, it tends to last for multiple years.
- Diversification is Key. The most important aspect of the chart below is that both U.S. and international markets have outperformed the same number of years (28 each) and average annualized returns for each asset class have been about the same (between 8.5% and 9.5%). Nobody knows what the future will bring and which asset class will outperform next; however, we can control staying diversified by investing in a wide range of asset classes to help avoid significant swings in portfolio returns and be better able to meet our long-term investment goals.
International vs. Domestic Returns
MSCI EAFE – MSCI U.S. Total Return Annual Difference Since 1970
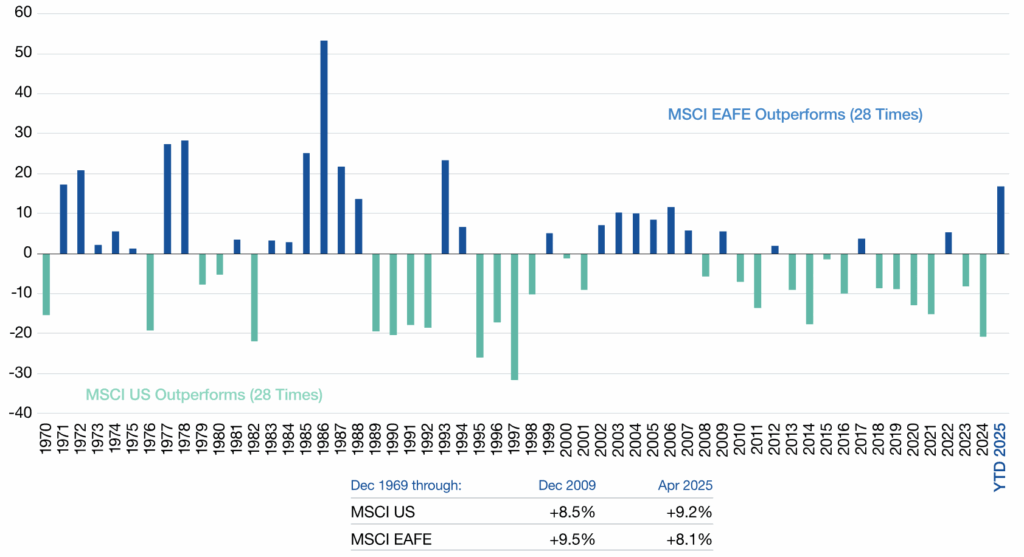
Source: Lazard Asset Management, “International Markets Gain Ground.” As of June 30, 2025. Returns since 1969 are annualized. The performance quoted represents past performance. Past performance is not a reliable indicator of future results. This information is for illustrative purposes only and does not represent any product or strategy managed by Lazard. It is not possible to invest directly in an index.
2. Large-Cap Growth vs. Small-Cap Value
One interesting market observation since the “rate cut rhetoric” started around the start of the third quarter is that small-cap stocks started to outperform large-caps. The last few years have not been kind to smaller companies as elevated interest rates have made it difficult for them to source debt. This has been exacerbated by the AI boom with mega-cap growth companies, often referred to as the “Magnificent 7,” stealing the spotlight.
But with large growth companies trading at nosebleed valuations and the Fed starting to cut rates, could this be the time for a much-awaited market performance rotation into smalls? Dimensional Fund Advisors (DFA) helps us make an evaluation of what we could expect at current valuations based on a historic comparison of large-cap and small-cap returns. Let’s look at the key observations:
- Cyclicality. An important market concept to keep in mind is markets are cyclical. This is true for asset classes, sectors, countries and individual companies. And the thesis makes intuitive sense: No one investment can consistently outperform. Eventually it reaches an elevated price and comes back down while beaten up investments rebound. The chart below demonstrates this as the line cycles over time through mountain peaks and valley troughs.
- Valuation. The chart shows when small-cap stocks underperform large-caps to the point of neutrality (0% level in the graph), there is often a strong short-term reversal (small-caps outperform over the following three-year periods). We happen to have reached that neutrality in 2024, something like what we saw at the end of 1999 (before the tech bubble burst). What followed that period was a strong bout of small-cap outperformance. Nobody has a crystal ball, but current valuations would suggest that the probabilities are in favor of smaller stocks.
- Diversification. While cyclicality and valuations can help guide performance, nobody really knows what the markets will do or when. This is why it’s always important to stay well diversified among a variety of asset classes which help offset each other depending on market environment. The result is a smoother ride over the long term, more stable returns, and a higher likelihood of staying invested for the long-term. Ultimately resulting in higher chances to reach investors’ long-term financial goals.
Large-Cap vs. Small-Cap Return Cycles
20-Year Rolling Return Difference Between the Dimensional U.S. Small Cap Value Index and S&P 500 Index May 1947–January 2024
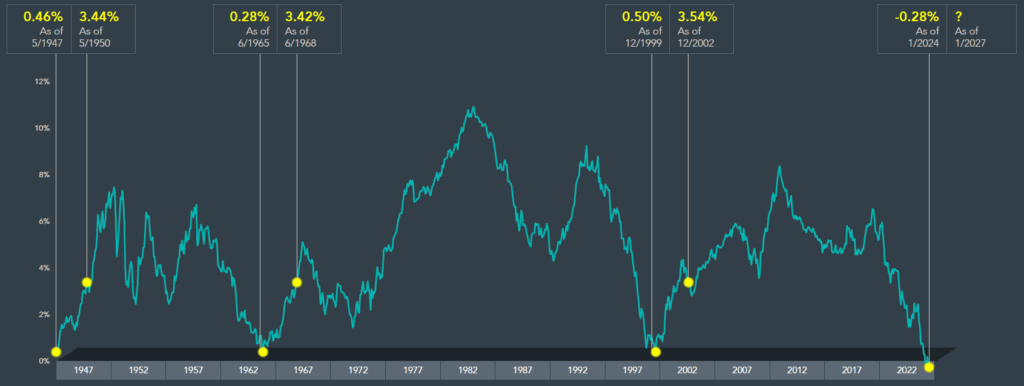
Source: Dimensional Fund Advisors, “Sticking Up for Small Value Stocks” by Wes Crill, PhD, May 1, 2024. Past performance is no guarantee of future results. Actual returns may be lower. The Dimensional indices represent academic concepts that may be used in portfolio construction and are not available for direct investment or for use as a benchmark. Index returns are not representative of actual portfolios and do not reflect costs and fees associated with an actual investment. See “Index Descriptions” for descriptions of the Dimensional index data. S&P data © 2024 S&P Dow Jones Indices LLC, a division of S&P Global. All rights reserved.
3. Stocks vs. Bonds
While we may be seeing a third consecutive year of standout stock market returns, we need to remember that corrections do happen and are a normal part of investing. And typically, in a market drawdown, you can rely on bonds to help offset the losses. But investors have been questioning, is this still the case?
I will be the first to say that there are enough things to worry about, your bond allocations shouldn’t be one of them. Bonds got a bad rep in 2022 when they fell at the same time as stocks. Traditionally, bonds tend to have an inverse relationship with stocks, particularly in market downturns, providing an important ballast in diversified portfolios. One argument is that 2022 was a unique situation given extreme levels of inflation. But has the situation changed now that we are back to more normal inflation levels?
Well, we did almost fall into a bear market this year as the S&P 500 fell about 19% between Feb. 19 and April 8, 2025. What did bonds do during this period? The bond market (as measured by the Bloomberg U.S. Agg Index) provided a calm and stable positive 1% return. Bonds did exactly what bonds are supposed to do.
But how rare is what happened in 2022, and how do bonds typically behave in a market downturn? Looking back through history to 1928, there have been 12 double-digit loss years for the S&P 500, listed below along with bond returns for those years. Key observations:
- Stocks vs. Bonds. When we average the 12 years of the worst market drops, we get just over a 22% loss. During those same years, the average bond return was a 3.5% gain (and a couple percent higher if you remove the 2022 outlier). Also keep in mind, the two strongest bond returns in the table happened during the 2002 tech bubble and the 2008 global financial crisis. These relatively recent events highlight the powerful combination and diversification benefit of mixing stocks and bonds.
- Is 2022 an Outlier? There were three instances where both stocks and bonds were negative. Two of those still maintained a double-digit difference between stock returns. Thus, 2022 does appear to be a unique situation, but could it happen again? Of course, anything is possible in the markets. But the data would suggest that probabilities are in favor of bonds protecting stocks during years with significant market drops.
- Win by Losing Less. One important note is the bond return in 2022 was the worst bond return for a given year on record by a wide margin (the next biggest drop was down 11%). That said, if you combine stocks and bonds in a 60/40 split, like many diversified portfolios do, you will notice the losses of the stock market average almost cut in half (whether 2022 is included or not). By not losing as much in those tumultuous years, investors are able to have downside protection and less ground to make up on the way back up. This ultimately offers a smoother ride over the long-term and is the key benefit of diversification.
Stay diversified, my friends.
The Worst Years for Stocks
S&P 500 and U.S. T. Bond 10-Year Total Returns from 1928
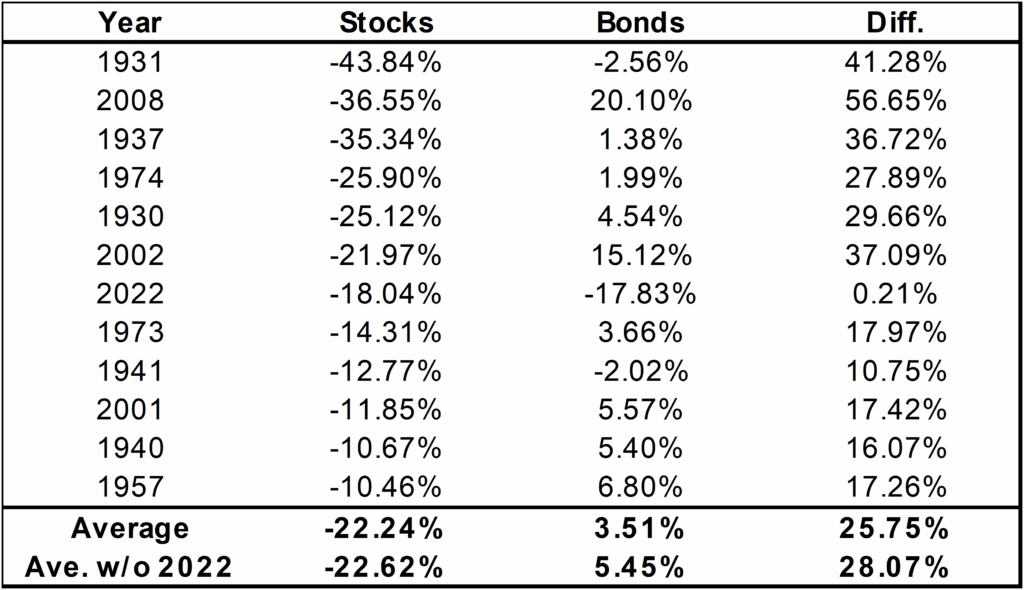
Sources: Historical Returns on Stocks, Bonds and Bills: 1928-2024. Created by Aswath Damodaran, adamodar@stern.nyu.edu. Stocks represented by S&P 500 Index Total Return and Bonds represented by U.S. Treasury Bond (10-year). Past performance is no guarantee of future results.
As always, Dynamic recommends staying balanced, diversified and invested. Despite short-term market pullbacks, it’s more important than ever to focus on the long-term, improving the chances for investors to reach their goals.
Should you need help navigating client concerns, don’t hesitate to reach out to Dynamic’s Asset Management team at (877) 257-3840, ext. 4 or assetmanagement@dynamicadvisorsolutions.com.
Disclosures
This commentary is provided for informational and educational purposes only. The information, analysis and opinions expressed herein reflect our judgment and opinions as of the date of writing and are subject to change at any time without notice. This is not intended to be used as a general guide to investing, or as a source of any specific recommendation, and it makes no implied or expressed recommendations concerning the manner in which clients’ accounts should or would be handled, as appropriate strategies depend on the client’s specific objectives.
This commentary is not intended to constitute legal, tax, securities or investment advice or a recommended course of action in any given situation. Investors should not assume that investments in any security, asset class, sector, market, or strategy discussed herein will be profitable and no representations are made that clients will be able to achieve a certain level of performance, or avoid loss.
All investments carry a certain risk and there is no assurance that an investment will provide positive performance over any period of time. Information obtained from third party resources are believed to be reliable but not guaranteed as to its accuracy or reliability. These materials do not purport to contain all the relevant information that investors may wish to consider in making investment decisions and is not intended to be a substitute for exercising independent judgment. Any statements regarding future events constitute only subjective views or beliefs, are not guarantees or projections of performance, should not be relied on, are subject to change due to a variety of factors, including fluctuating market conditions, and involve inherent risks and uncertainties, both general and specific, many of which cannot be predicted or quantified and are beyond our control. Future results could differ materially and no assurance is given that these statements or assumptions are now or will prove to be accurate or complete in any way.
Past performance is not a guarantee or a reliable indicator of future results. Investing in the markets is subject to certain risks including market, interest rate, issuer, credit and inflation risk; investments may be worth more or less than the original cost when redeemed.
Investment advisory services are offered through Dynamic Advisor Solutions, LLC, dba Dynamic Wealth Advisors, an SEC registered investment advisor.
Photo: Adobe Stock