

Download the 7.22.24 Dynamic Market Update for advisors’ use with clients
By Kostya Etus, CFA®, Chief Investment Officer, Dynamic Investment Management
Mid-Year Review
The market had a great first half to 2024, with the S&P 500 up over 15% through the end of June. While market performance has largely been driven by Nvidia and the “Fabulous Three”—Amazon, Facebook/Meta, and Microsoft—we have also seen more broad-based positive performance from other areas of the market. More recently in July, we have seen the resurgence of performance from mid and small cap stocks as well as value stocks as we continue to see favorable data. Let’s review some of the latest numbers:
- Inflation Continues to Fall – The most notable news of late is the June Consumer Price Index (CPI) from the U.S. Bureau of Labor Statistics which surprised with a rate of 3.0%, the lowest in a year. Core CPI—less food and gas—was also below expectations at 3.3%. Lower inflation bodes well for interest rate cuts later this year by the Federal Reserve (Fed). Lower interest rates are more beneficial for smaller companies and value stocks and this was apparent in their outperformance after the inflation data was released.
- Broadening Corporate Earnings – Earnings season is just kicking off but expectations for year-over-year growth for the S&P 500 are at 8.8% for the second quarter. This would mark the fastest pace since the start of 2022, but more importantly, eight out of the eleven sectors are projected to have positive growth. This is another sign that other areas of the market—outside of technology and communication services stocks—may see a favorable reversal.
- Labor Market Balancing – The unemployment rate ticked up to 4.1%. While this is the highest rate since late 2021, it remains a historically low rate and not necessarily a bad sign as it supports a cooling, yet positive, economic growth. This is the scenario that the Fed is looking for to start cutting rates, a moderating inflation and balanced economic activity.
Lower inflation and a balanced economy enhance the chances of an interest rate cut later this year. This would be beneficial for most broad-based asset classes including stocks, bonds, and real estate. A rate cut, paired with strong corporate earnings, could be particularly beneficial for undervalued areas of the market such as small-cap and value stocks.
Diversification Math Lesson
As I discussed in my last market update, we are seeing concentration risk in certain areas of the market, particularly with a handful companies which have been driving a large portion of total market returns over the past year and a half. These companies are now trading at very high valuations and, given that markets are cyclical, there may be a reversal of fortunes coming up, while other companies catch up.
Over-concentrating to fewer areas of the market leaves your portfolio open to the risk of more severe drops, which may be hard to recover from. The chart below helps to illustrate how diversification can help alleviate some of these risks:
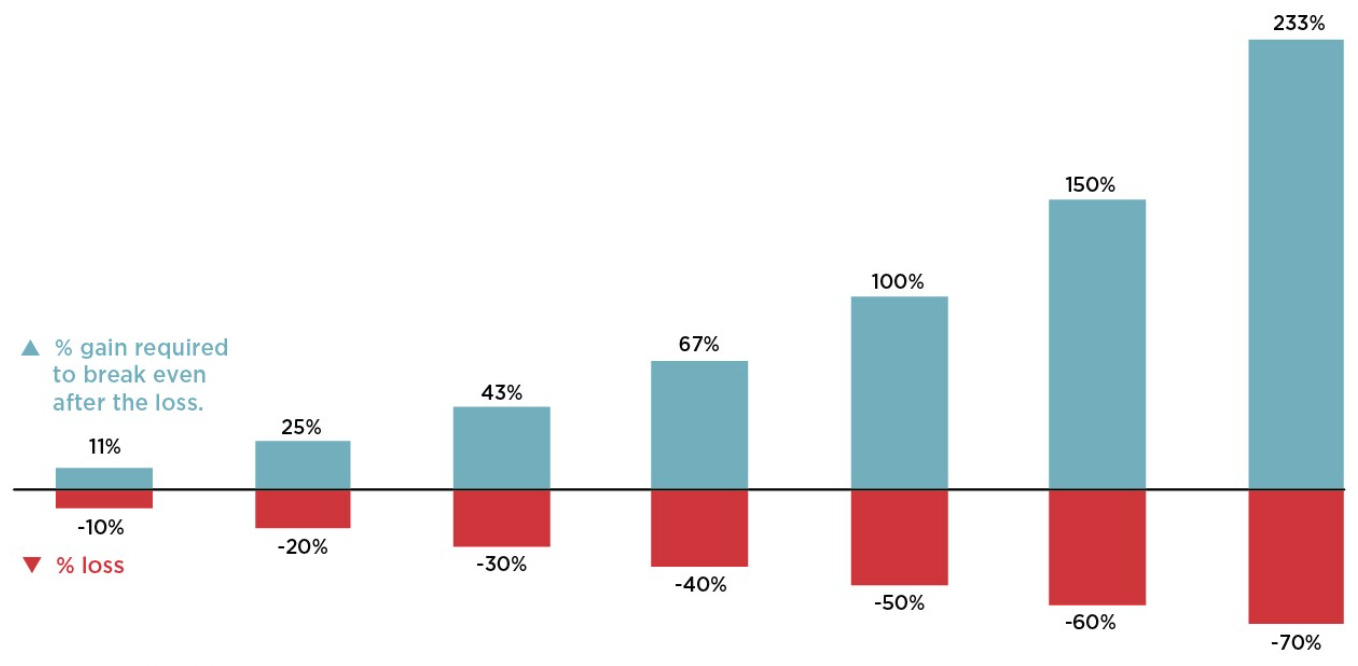
- The $100 Example – Let’s say you start with $100 and in year 1 your portfolio drops 10%, you are left with $90. In year 2, the market rebounds 10%, and you rejoice, until realizing you only have $99. You actually need an 11% rebound in year 2 to get back to your starting amount of $100. The balance between losses and gains needed to recover is not symmetric, and it gets harder to recover the more you lose.
- Win by Losing Less – By allocating to various different asset classes which are less correlated with each other, you are able to dampen the losses in any period. If you lose less, then it becomes easier to recover when the rebound occurs. This is particularly true for more severe market drops. Notice that a 50% loss requires a 100% gain to recover but a slightly larger 60% drop needs a whopping 150% return to make it back.
- Diversification for the Long-Term – A globally diversified and balanced portfolio approach helps support a smoother ride over the long-term, with less severe drawdowns. During the 2007-2009 Financial Crisis, the S&P 500 lost about 51%, which would have required close to a 105% return to recover. Meanwhile, a 60% global stock / 40% bond diversified portfolio would have lost about 35%, only requiring a 53% recovery to recoup losses.
Stay diversified, my friends.
Percentage Return Required to Fully Recover from a Loss
Source: Nationwide IMG Competitive Intelligence Team.
As always, Dynamic recommends staying balanced, diversified and invested. Despite short-term market pullbacks, it’s more important than ever to focus on the long-term, improving the chances for investors to reach their goals.
Should you need help navigating client concerns, don’t hesitate to reach out to Dynamic’s Investment Management team at (877) 257-3840, ext. 4 or investmentmanagement@dynamicadvisorsolutions.com.
Disclosures
This commentary is provided for informational and educational purposes only. The information, analysis and opinions expressed herein reflect our judgment and opinions as of the date of writing and are subject to change at any time without notice. This is not intended to be used as a general guide to investing, or as a source of any specific recommendation, and it makes no implied or expressed recommendations concerning the manner in which clients’ accounts should or would be handled, as appropriate strategies depend on the client’s specific objectives.
This commentary is not intended to constitute legal, tax, securities or investment advice or a recommended course of action in any given situation. Investors should not assume that investments in any security, asset class, sector, market, or strategy discussed herein will be profitable and no representations are made that clients will be able to achieve a certain level of performance, or avoid loss.
All investments carry a certain risk and there is no assurance that an investment will provide positive performance over any period of time. Information obtained from third party resources are believed to be reliable but not guaranteed as to its accuracy or reliability. These materials do not purport to contain all the relevant information that investors may wish to consider in making investment decisions and is not intended to be a substitute for exercising independent judgment. Any statements regarding future events constitute only subjective views or beliefs, are not guarantees or projections of performance, should not be relied on, are subject to change due to a variety of factors, including fluctuating market conditions, and involve inherent risks and uncertainties, both general and specific, many of which cannot be predicted or quantified and are beyond our control. Future results could differ materially and no assurance is given that these statements or assumptions are now or will prove to be accurate or complete in any way.
Past performance is not a guarantee or a reliable indicator of future results. Investing in the markets is subject to certain risks including market, interest rate, issuer, credit and inflation risk; investments may be worth more or less than the original cost when redeemed.
Investment advisory services are offered through Dynamic Advisor Solutions, LLC, dba Dynamic Wealth Advisors, an SEC registered investment advisor.
Photo: Adobe Stock