

Download the 10.31.25 Dynamic Market Update for advisors’ use with clients
By Kostya Etus, CFA®, Chief Investment Officer, Dynamic Asset Management
Happy Halloween! We have a special edition of Dynamic Market Update in honor of this week’s Federal Reserve (Fed) meeting. Investors were looking forward to the big interest rate decision to see if Fed Chair Jerome Powell would deliver a trick or treat.
In typical Fed fashion, he delivered both. The treat was the second 0.25% interest rate cut of 2025, following the one in September, with the current rate now in the range of 3.75% to 4.00%. The trick came at the post-meeting press conference where Powell indicated, “A further reduction in the policy rate at the December meeting is not a foregone conclusion. Far from it.” This sent the stock and bond markets lower, as the possibility of longer dated interest rates increased.
Here are some of the key messages from the Fed in terms of how they concluded to cut and what they’re looking for going forward:
- Inflation. The latest Consumer Price Index (CPI) inflation measure was released last week by the U.S. Bureau of Labor Statistics (despite the government shutdown). It showed the annual inflation rate crept up to 3% in September (up from 2.9% the previous month). While this was the highest reading since January, it was well received given it was below economic forecasts. More importantly, Core CPI, which excludes the more volatile food and energy prices, was also reported at 3%. This figure, however, was a reduction from previous months and likewise below forecasts. All in all, this report signified continued stability in the inflation rate, albeit at elevated levels relative to the 2% Fed target.
- Unemployment. Outside of the inflation report, economic data has been sparce given the shutdown. This creates a certain level of uncertainty given how data-dependent Fed decisions tend to be. While the last unemployment rate reading in early September showed an uptick to a moderate 4.3%, the Fed believes it may be edging up further. Their comments reinforced the belief that broad economic activity may be moderating and downside risks to employment have increased in recent months. Ultimately, more employment data is required to have a better view of what the Fed may do in December.
If the current trends persist, including 1) core inflation stays put, or comes down, and 2) employment weakens, we will likely see another cut to finish off 2025. But in either scenario, cut or no cut, the economy and the markets maintain their resilience and potential for reinforcements as we officially kick off the holiday season where consumer spending and spirits go up!
Top 10 Transformation
Today’s largest companies in the world seem unstoppable. But were they always at the top? As the prices of the top 10 surge, so do their valuations. Remember, in the markets, what goes up, must come down… eventually. But these magnificent, growth-focused U.S. tech giants seem unstoppable. So, investors are left wondering, can they stay at the top forever? And what do returns looks like after companies get to the top?
To help answer these questions and more, here’s a look at the top 10 companies at the end of each decade since 1980. Looking at the data, you may be surprised at what you see:
- Not All U.S. Growth. Looking through the decades, it’s not always technology stocks or growth-focused companies that populate the top 10. We see a slew of oil, banking, car manufacturers and communication companies dominating the first four decades on the list. Additionally, depending on the decade, various countries around the globe come into the picture, including emerging markets like China.
- Not Great Return Outlooks. The chart also shows the forward 10-year returns of each top 10 stock and how they compare to the world index return. While some outliers exist, most stocks have below-benchmark returns, and several have negative returns. This reinforces the notion that valuations do matter, and companies move through cycles.
- Diversification Lasts. Perhaps the most impactful parts of the chart are the world index returns (bottom row). No one has a crystal ball and it’s hard to tell which companies will be the top 10 next decade. By investing in a wide range of companies, sectors and countries, investors can smooth out returns and compound them over time. This ultimately results in higher chances to reach long-term investment goals.
Stay diversified, my friends.
The Global Leaders of Today May Not Be Leaders of Tomorrow
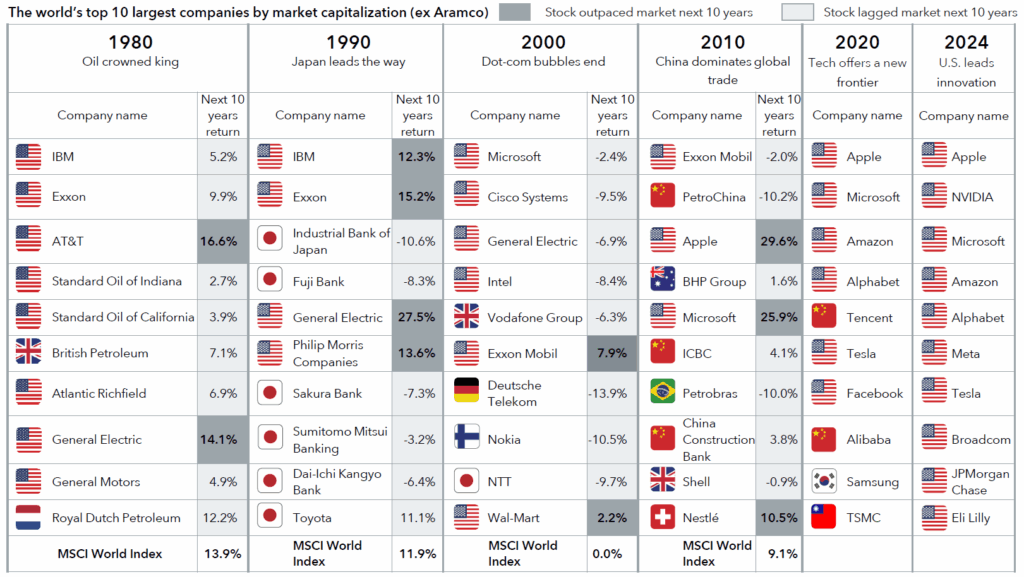
Sources: Capital Group equity insights third quarter 2025: “The great global reset: New opportunities in broadening markets.” Data from: Capital Group, MSCI, RIMES. As of 12/31/24. Past results are not predictive of results in future periods. Next 10 years return refers to the average annual total return of the stock or index from the current decade’s beginning observation date to the beginning of the next decade. Observation date for each set of holdings is December 31 of the year, except in 2000. For example, for 1980, the observation date for the largest companies is 12/31/1980. The exception for 2000 uses the observation date of 2/28/2000, as it reflects the closest month-end peak of the tech bubble.
As always, Dynamic recommends staying balanced, diversified and invested. Despite short-term market pullbacks, it’s more important than ever to focus on the long-term, improving the chances for investors to reach their goals.
Should you need help navigating client concerns, don’t hesitate to reach out to Dynamic’s Asset Management team at (877) 257-3840, ext. 4 or investmentmanagement@dynamicadvisorsolutions.com.
Disclosures
This commentary is provided for informational and educational purposes only. The information, analysis and opinions expressed herein reflect our judgment and opinions as of the date of writing and are subject to change at any time without notice. This is not intended to be used as a general guide to investing, or as a source of any specific recommendation, and it makes no implied or expressed recommendations concerning the manner in which clients’ accounts should or would be handled, as appropriate strategies depend on the client’s specific objectives.
This commentary is not intended to constitute legal, tax, securities or investment advice or a recommended course of action in any given situation. Investors should not assume that investments in any security, asset class, sector, market, or strategy discussed herein will be profitable and no representations are made that clients will be able to achieve a certain level of performance, or avoid loss.
All investments carry a certain risk and there is no assurance that an investment will provide positive performance over any period of time. Information obtained from third party resources are believed to be reliable but not guaranteed as to its accuracy or reliability. These materials do not purport to contain all the relevant information that investors may wish to consider in making investment decisions and is not intended to be a substitute for exercising independent judgment. Any statements regarding future events constitute only subjective views or beliefs, are not guarantees or projections of performance, should not be relied on, are subject to change due to a variety of factors, including fluctuating market conditions, and involve inherent risks and uncertainties, both general and specific, many of which cannot be predicted or quantified and are beyond our control. Future results could differ materially and no assurance is given that these statements or assumptions are now or will prove to be accurate or complete in any way.
Past performance is not a guarantee or a reliable indicator of future results. Investing in the markets is subject to certain risks including market, interest rate, issuer, credit and inflation risk; investments may be worth more or less than the original cost when redeemed.
Investment advisory services are offered through Dynamic Advisor Solutions, LLC, dba Dynamic Wealth Advisors, an SEC registered investment advisor.
Photo: Adobe Stock