

Download the 7.25.25 Q2 ’25 Investing Insights for advisors’ use with clients
By Kostya Etus, CFA®
Chief Investment Officer, Dynamic Asset Management
“The flower that blooms in adversity is the most rare and beautiful of all.”
– The Emperor of China (Pat Morita),“Mulan,” 1998
Key Takeaways
- What should investors expect after years with strong gains? More gains.
- What should investors expect after large daily gains or losses? More gains.
- What should investors expect after a strong May? More gains.
Market Review
The second quarter has been quite a ride. We started out of the gate with more than a 10% drop for the market (S&P 500) in early April, fueled by tariff fears, putting us near bear market territory (close to 20% loss from peak). We then saw a negative quarterly economic growth print for GDP, didn’t get any interest rate cuts from the Federal Reserve (Fed), and finished off the quarter with bombings in the Middle East. With that much bad news, you would not have expected the market to be up 11% in the second quarter, reaching all new highs! Combined with the weaker first quarter, we are still up a solid 6% in the U.S., while international markets continue their rally, up over 18% on the year.
Let’s take a closer look at the key factors impacting the market strength in the second quarter:
- Corporate Profits. Let’s remember that while short-term market volatility may be influenced by media headlines, over the long-term the market really cares about fundamentals. And the most fundamental is whether companies are making profits. The first quarter earnings, which are reported throughout the second quarter, grew by almost 13%. That marks the second straight quarter of double-digit growth. Furthermore, 78% of companies exceeded their earnings estimates. While companies are growing profits and beating expectations, the market has growth potential. (Data from FactSet.)
- Labor Market. There was chatter of a recession throughout the first half, but nobody told the labor market. More than 100,000 new jobs were created each month this year, often beating expectations. Meanwhile, the unemployment rate remains at historic lows, most recently beating expectations with a 4.1% print. These figures certainly don’t point to a recession soon and offer solid footing for the economy and market to stand on. (Data from U.S. Bureau of Labor Statistics)
- Reduced Fears. Tariffs and inflation are not as bad as expected. Many tariffs have been delayed or resulted in trade deals, while upward inflationary pressures on products have been mitigated with downward pressures on services. While inflation remains rangebound, the Fed stays in an accommodative stance. Meaning there are no interest rate increases on the horizon, and expectations are for two interest rate cuts in the second half of 2025. This rhetoric provides potential tailwinds for the markets moving forward.
While the headlines were sensational in the second quarter, the market was more focused on fundamentals and cooler heads prevailed, as exhibited with solid market returns. Looking forward, the factors described above will continue to pave the path for potentially more gains, including continued growth in corporate profits, a healthy labor market, and an accommodative Fed which remains in a rate-cutting cycle.
Asset Class Returns through Q2 2025
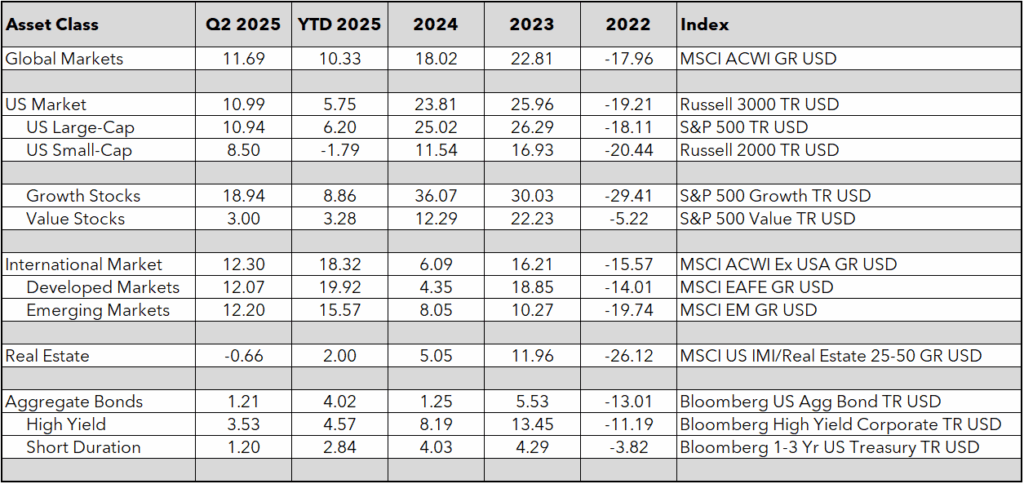
Source: Morningstar Direct as of 6/30/2025. Past performance does not guarantee or indicate future results.
- What to Expect after Great Years?
We often say the stock market historically returns about 8-12% per year. But how often has it been in that range? And how rare are the returns we exhibited the last two years of being up more than 25%? Most importantly, what can we expect for returns following great market years? The answers to these questions may help investors manage expectations about stock market returns and be better prepared for the future.
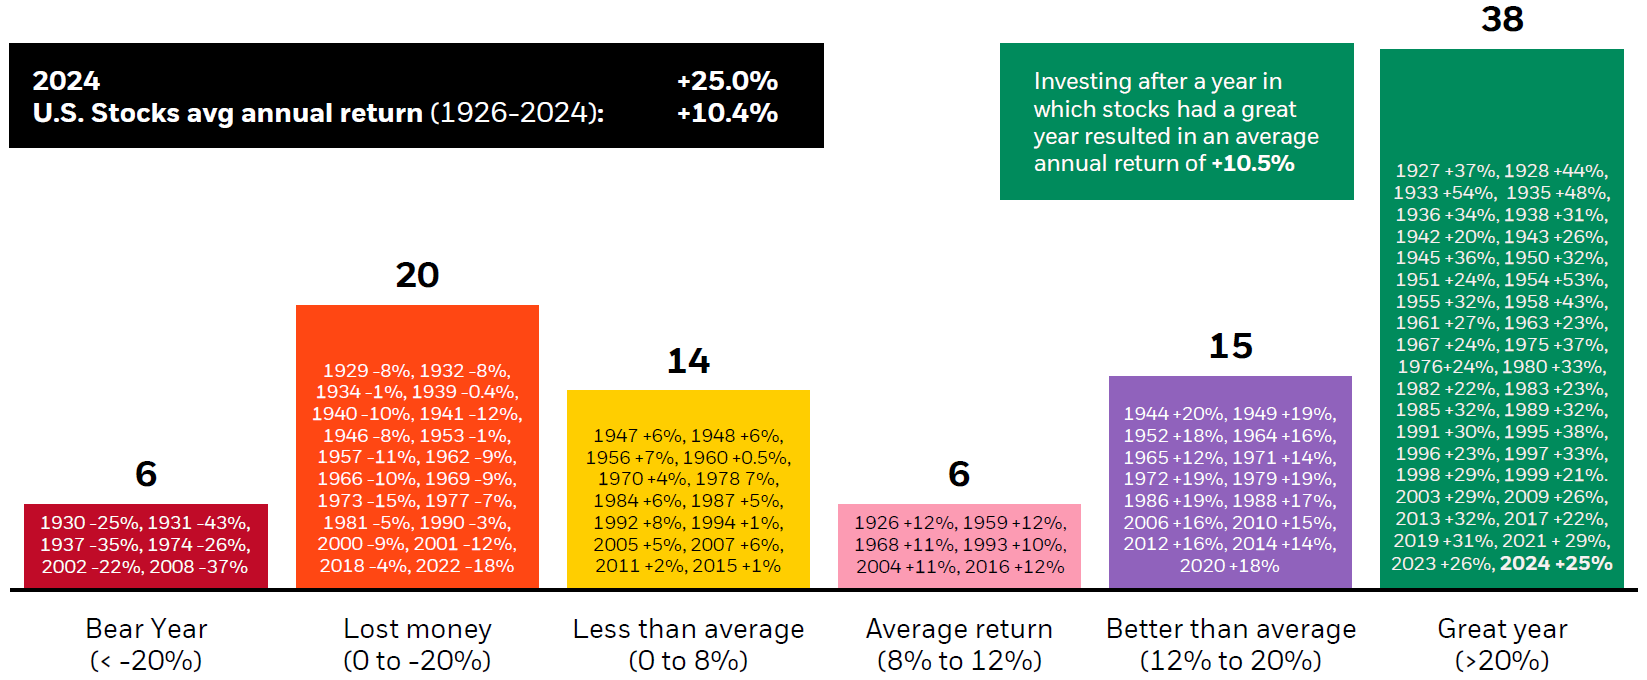
To help answer these questions, let’s look at the distribution of calendar year returns, dating back to 1926. You may be surprised by the results:
- Almost Never 8-12%. The number we quote most frequently turns up the least! This is both the beauty and the risk of the markets, they are volatile and very unpredictable. That said, the idea behind this range is that investing is a long-term game. So yes, in any given year the returns could be all over the place, but if you zoom out at the big picture, about 10% per year is where you land.
- Many over 20%. An astounding 38 out of 99 observations are over 20%. This is by far the largest category for range of returns. And there are only six observations of less than -20%, so the strong returns are overwhelmingly positive. That said, the second largest observed range is 0% to -20%.
- Strong after Great Years. Perhaps most importantly, investing after a great year (over 20%) has resulted in an average annual return of +10.5%, approximately in line with the historic long-term average. Thus, it may not matter as much what happened last year, the market always looks to the future.
Overall, there are 73 total positive returns out of 99 years. This means that more than two thirds of the time, the market is positive. That is certainly more than a coin flip and an additional reason to always stay invested. Again, the long-term game is how you beat the house at the game of markets.
Range of Returns for Stocks by Calendar Year
Average Annual Return Jan. 1, 1926 – Dec. 31, 2024
U.S. stock market during each given period. Past performance does not guarantee or indicate future results. Index performance is for illustrative purposes only. You cannot invest directly in the index.
- What to Expect after the Biggest Daily Moves?
We experienced some extreme market volatility at the start of the second quarter, which is indicative of huge market swings on any given day. In fact, in April we witnessed one of the largest four-day declines on record as well as one of the best days on record. It’s always interesting how the worst and best days seem to cluster.
But what happens to the market after these extreme days? And what can investors expect going forward based on historic trends, let’s take a look:
- Forward Returns after the Biggest Four-Day Declines. The S&P 500 experienced its 12th biggest four-day decline since 1950 in April. But looking at the other 14 declines on the list, we notice that all the forward returns are double-digit positive. Further, the one-year forward return is an average 34%, the three-year average is 49%, and the five-year average return is an astounding 112%. It certainly seems like staying invested after these significant downturn days benefitted investors.
- Forward Returns after the Biggest One-Day Gains. The very next day after that large four-day drop, we saw the third biggest one-day gain, with a pop of 9.5%. Looking at the other gains on the list, the average forward one-year return is 39%, the three-year average is 56%, and the five-year average is 125%. These averages are even higher than above.
- Whether Up or Down, It’s Always a Great Time to Invest. One key observation is the average returns after the big drops are similar to forward returns after the big gains. But it may not be surprising if you consider another interesting observation that some of the best days are often clustered in with the worst. Which reinforces the importance of staying invested for the long-term and not panic selling or trying to time the market during volatility.
Forward Returns after the Biggest Declines and Gains
S&P 500 Total Returns 1950-2025
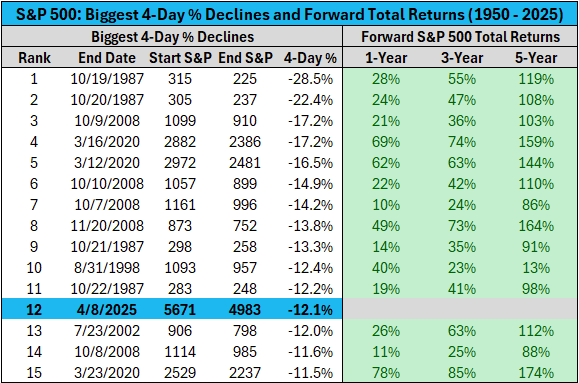
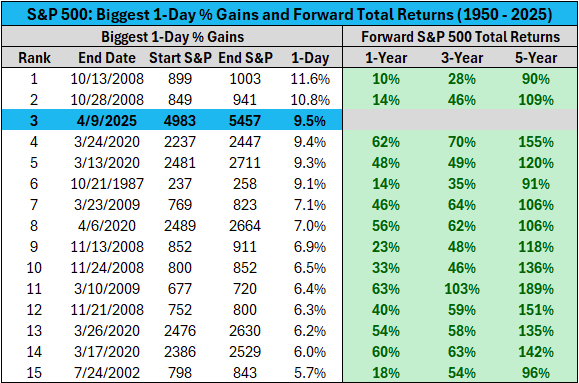
Source: Bilello.Blog by Charlie Bilello: “The Week in Charts” (4/14/25). Past performance does not guarantee or indicate future results.
- What to Expect after One of the Best Mays?
There is an old investing adage that goes “Sell in May and Go Away.” The story behind it suggests that stock market seasonality has historically favored winter and spring months (November 1 to April 30), while the summer and fall struggle (May 1 to October 31).
There may be some intuitive reasoning to favor winter months, which are heavy with key holidays and shopping events, while the summer lull sets in with more vacations and lower trading volumes. But what does data show about historic returns during these date ranges? And what does this year’s May performance say about what to expect going forward? Let’s explore:
- Does the theory hold? According to BlackRock research, looking back to 1926, the average return from May 1 to October 31 has been 4.3%, while the return from November 1 to April 30 has averaged 7.4%. This is quite a wide margin. But note, a 4.3% return is still strong for a six-month period on an absolute basis, particularly when considering compounding. It certainly would not suggest that you sell out of the market.
- What if there is a strong May? After three consecutive months of losses to kick off 2025, we saw a strong 6.3% rebound in May. It was the second strongest May on record (see table below). Interestingly, of the other nine top Mays, seven had very strong double-digit returns through the end of the year. So, I’m going to coin a new saying: “If there is a strong May, you are here to stay!”
- Does it matter? While it may be fun to analyze this type of data, it has little impact on long-term investment returns. As mentioned, even seasonally weaker months produce positive returns on average, and there are significant risks of missing out on those returns. Remember that staying invested and diversified for the long-term provides the best chances of achieving your investment objectives.
Stay diversified, my friends.
Returns after the “Best” Mays
S&P 500 Total Returns During Specific Years Since 1926
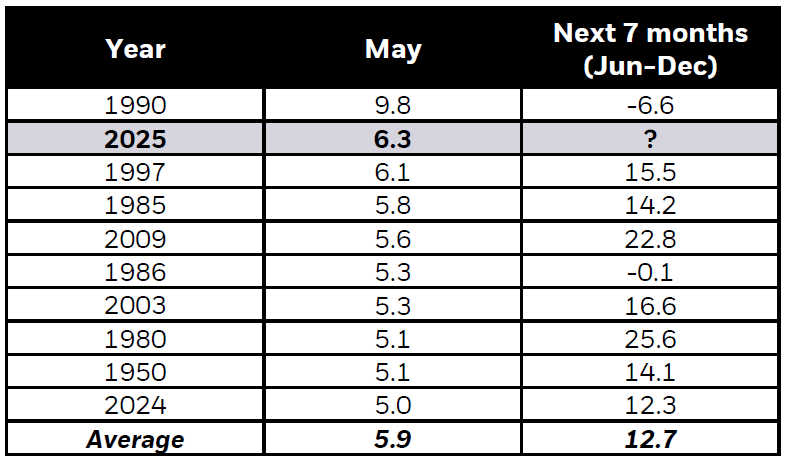
Source: BlackRock’s “Student of the Market,” June 2025. Morningstar as of 5/31/25. U.S. Stocks are represented by the S&P 500 TR Index. Past performance does not guarantee or indicate future results. Index performance is for illustrative purposes only. You cannot invest directly in the index.
As always, Dynamic recommends staying balanced, diversified and invested. Despite short-term market pullbacks, it’s more important than ever to focus on the long-term, improving the chances for investors to reach their goals.
Should you need help navigating client concerns, don’t hesitate to reach out to Dynamic’s Asset Management team at (877) 257-3840, ext. 4 or assetmanagement@dynamicadvisorsolutions.com.
Disclosures
This commentary is provided for informational and educational purposes only. The information, analysis and opinions expressed herein reflect our judgment and opinions as of the date of writing and are subject to change at any time without notice. This is not intended to be used as a general guide to investing, or as a source of any specific recommendation, and it makes no implied or expressed recommendations concerning the manner in which clients’ accounts should or would be handled, as appropriate strategies depend on the client’s specific objectives.
This commentary is not intended to constitute legal, tax, securities or investment advice or a recommended course of action in any given situation. Investors should not assume that investments in any security, asset class, sector, market, or strategy discussed herein will be profitable and no representations are made that clients will be able to achieve a certain level of performance, or avoid loss.
All investments carry a certain risk and there is no assurance that an investment will provide positive performance over any period of time. Information obtained from third party resources are believed to be reliable but not guaranteed as to its accuracy or reliability. These materials do not purport to contain all the relevant information that investors may wish to consider in making investment decisions and is not intended to be a substitute for exercising independent judgment. Any statements regarding future events constitute only subjective views or beliefs, are not guarantees or projections of performance, should not be relied on, are subject to change due to a variety of factors, including fluctuating market conditions, and involve inherent risks and uncertainties, both general and specific, many of which cannot be predicted or quantified and are beyond our control. Future results could differ materially and no assurance is given that these statements or assumptions are now or will prove to be accurate or complete in any way.
Past performance is not a guarantee or a reliable indicator of future results. Investing in the markets is subject to certain risks including market, interest rate, issuer, credit and inflation risk; investments may be worth more or less than the original cost when redeemed.
Investment advisory services are offered through Dynamic Advisor Solutions, LLC, dba Dynamic Wealth Advisors, an SEC registered investment advisor.
Photos: Adobe Stock