

Download the 02.06.25 Dynamic Q4 2025 Investing Insights for advisors’ use with clients
By Kostya Etus, CFA®
Chief Investment Officer, Dynamic Asset Management
“’What’ and ‘if’ are two words as non-threatening as words can be. But put them together side-by-side and they have the power to haunt you for the rest of your life.”
– Claire (Vanessa Redgrave),“Letters to Juliet,” 2010
Market Review
As we look back on 2025, it’s worth reflecting on how stupendous the stock market performed. The U.S. market was up nearly 18% (as measured by the S&P 500), making it the third year in a row of close-to or more than 20% returns. That said, international markets were the darlings of 2025, finishing the year with over a 33% return. And bonds delivered commendable returns at more than 7%. Overall, it was a good year to be a diversified investor.
In terms of what to expect going forward, we can look at recent economic data and its implications to help shape those outlooks:
- Labor Market Data. The U.S. economy added 50,000 jobs in December 2025, below consensus estimates. This reading was a reinforcement of the Federal Reserve’s (Fed) expectations for a slowdown in the labor market, supporting the rhetoric for more interest rate cuts in 2026, since rate cuts could provide a boost to the economy. Current market probabilities imply a potential 0.25% cut around midyear and potentially a second one going into year end. In terms of economic implications, it’s interesting to note the unemployment rate dropped to 4.4%, coming in lower than expectations. This reflects a healthy labor market and economy, meaning we may be slowing down, but we aren’t necessarily near a recession.
- Inflation Data. We also received our first “relatively clean” consumer price inflation (CPI) report post-government shutdown. The CPI rate for December 2025 came in at 2.7%, matching expectations as well as the reading from November. More importantly, the Core CPI rate, which excludes the more volatile food and energy prices and is the preferred measure by the Fed, was 2.6%, lower than expectations. This also bodes well for Fed rate cut expectations, as they wouldn’t want to lower rates if inflation is too high, since lower interest rates often correlate with higher inflation.
In summary, the combination of a softening labor market and steady inflation provide a runway for the stock market to continue to shine in 2026, based on expectations of Fed rate cuts and a continued accommodative monetary policy. This is important for investors given lower interest rates are beneficial for companies and consumers in terms of more affordable loans, supportive of bond prices (lower rates equals higher prices) and a needed relief for the real estate market. So far, things are looking bright for 2026.
Asset Class Returns through Q4 2025
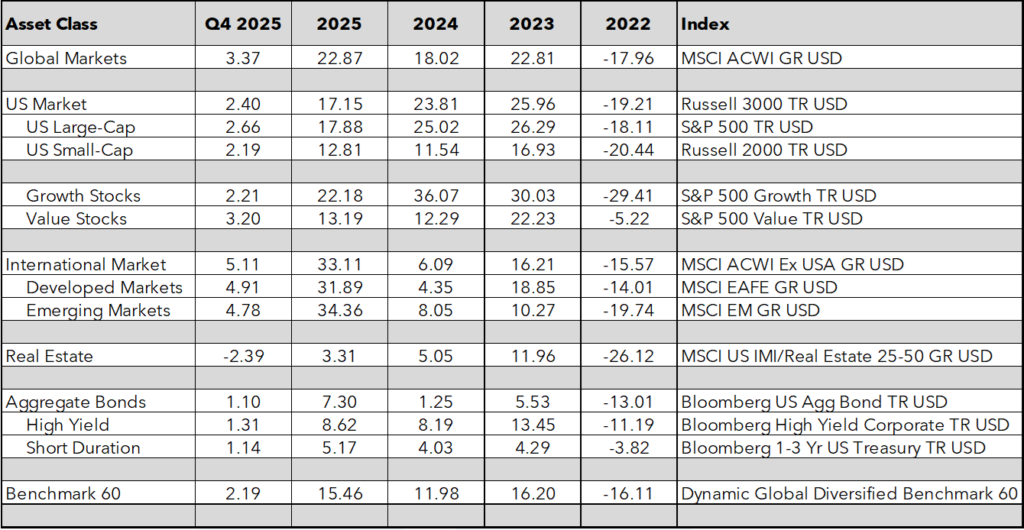
Source: Morningstar Direct as of 12/31/2025. Past performance does not guarantee or indicate future results.
Key Takeaways:
- What if the U.S. experiences a recession? We explore market impact based on various interest rate environments.
- What if the stock market has a correction? We review what happened in 2025 to try and draw parallels of what to expect in 2026.
- What if new asset classes start to outperform? We reinforce the importance of staying diversified and invested across the globe.
What If the U.S. Experiences a Recession?
The Fed has gifted investors three interest rate cuts in 2025, with expectations for more to come. Interest rate cuts are a way to stimulate the economy by enticing consumers and companies to spend/borrow more.
At the same time, economic growth has been resilient. While we have seen some cracks in the employment payroll numbers, unemployment has been at historically low levels. Furthermore, inflation appears to be stable, albeit somewhat elevated.
This translates to a potential Goldilocks scenario of rate cuts without a recession. However, it’s prudent to never discount a negative outcome for the economy or the markets. After all, it would have been hard to predict something like COVID. So, what can we expect going forward?
The graph below segments the time periods over the past 35 years into scenarios of Fed rate cycles (cutting, raising or on pause) and adds the backdrop of whether a recession happens within a year of each rate decision. Let’s look at the data to learn more about various potential scenarios:
- Goldilocks Scenario. The box in the top left highlights the scenario we describe above: a Fed cutting rate cycle with potentially no recession on the horizon. This is a fairly rare occurrence, happening only 5% of the time, but if the Fed can thread this needle, stock investors are in for a treat. Historically it has resulted in an average 17% growth in the stock market over the following year, the highest of any other quadrant. Note, in every scenario without a recession, there is a double-digit stock market return, regardless of rate decisions.
- Recession Scenario. While the top-left box is a relatively strong one for bonds, given that falling rates typically translates to a rise in bond prices, bonds care a lot more about recessions. There is generally an inverse relationship between stocks and bonds during recessions, meaning the more stocks fall, the better bonds perform. This is why all periods with a recession tend to have strong bond returns.
- Diversification is Best. Regardless of the scenarios, if you had an even split of stocks and bonds, there would be no periods of negative returns on average. Nobody knows the future. We don’t know when the Fed will cut rates and by how much, and we certainly don’t know when or if a recession will hit, or how impactful it will be. But what we can control is how diversified our portfolios are and how much risk we take on. Staying diversified, risk-balanced and invested through a wide range of scenarios is the best way to achieve long-term investment goals.
Stock and Bond Market Returns in Various Rate and Recession Backdrops
One-Year Average Forward Returns Jan. 1, 1990 – Sept. 30, 2025
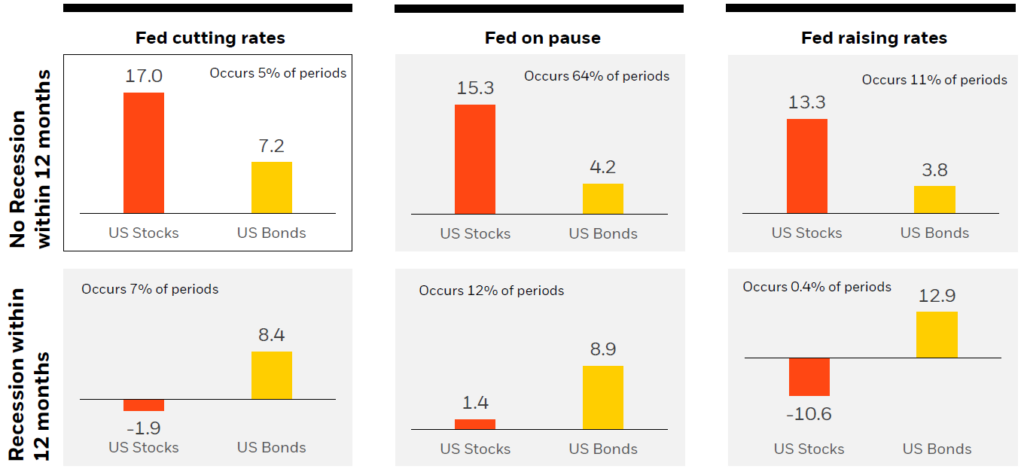
Source: Blackrock October 2025 publication: “Student of the Market.” Data from Morningstar as of 9/30/25. U.S. stocks are represented by the S&P 500 Index, U.S. bonds represented by the Bloomberg U.S. aggregate bond index, Past performance does not guarantee or indicate future results. Index performance is for illustrative purposes only. You cannot invest directly in the index.
What If the Stock Market Has a Correction?
Hindsight is always 20/20. While 2025 was a great year for overall market returns, the ride to get there was volatile. Studying what happened to the market throughout the year can help us glean important insights and perhaps learn lessons about how the market works and how to best navigate it as we look onward. Let’s look at some key observations:
- Rough Start. While it may seem like a distant memory,perhaps one of the most impactful reminders of 2025 is the market reached “bear market” territory (a drop of 20% or more) on April 7, primarily due to tariff announcements. April 4 was one of the worst days in history with the market dropping 6% in one day.
- Strong Finish. It took 54 trading days to recover the losses at the start of the year and then we were off to the races. That said, the market still exhibited three more short-term pullbacks throughout the remainder of the year. But it’s staggering to note that since the market bottom on April 8, they market rallied nearly 40% through year end.
- Stay the Course. Each year, we are reminded the market is not a smooth ride, and 2025 was no different. And despite the strong outcome, it may be surprising that more than 40% of trading days throughout the year were negative. While better than a coin flip, it’s a reminder of just how hard it is to try and time the market. The best approach is often to stay invested for the long-term, ignore the short-term volatility and increase the chances of reaching your investment goals.
S&P 500 Index by the Numbers in 2025
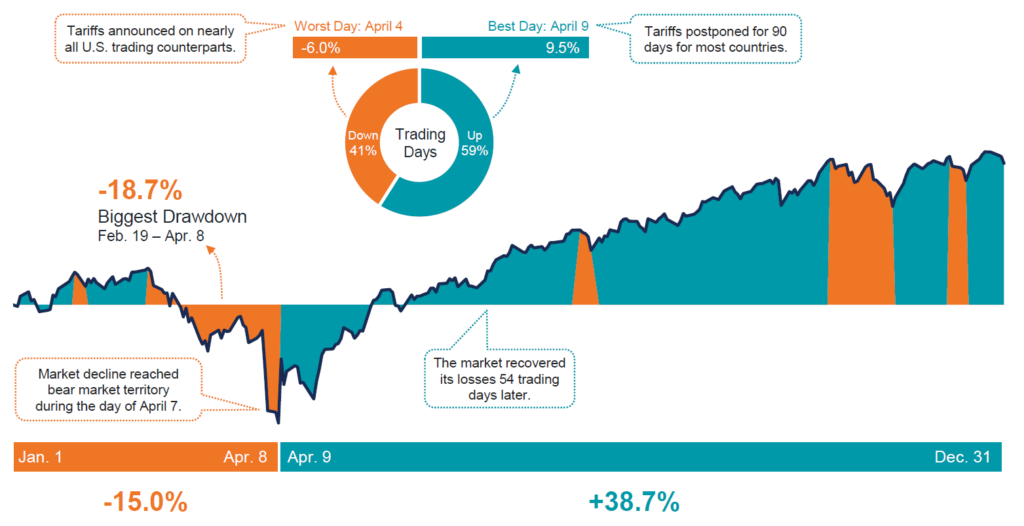
Source: Avantis Investors By American Century Investments, “Monthly ETF Field Guide” publication, December 2025. Data from 1/1/2025 – 12/31/2025. Source: Bloomberg, Avantis Investors. Past performance is no guarantee of future results.
What If New Asset Classes Start to Outperform?
Throughout 2025, we have discussed some of the extreme concentrations we are seeing in the U.S. stock market given the boom of the AI-focused Magnificent 7 companies. But this has given way to the potential of reversals in market leadership as value, small and international companies are trading at very attractive valuations. In fact, we began seeing one of these rotations play out with the strong outperformance of international markets.
Aside from being undervalued, international markets have benefitted from a weaker U.S. dollar, making investments abroad more valuable. Additionally, differences in economic or monetary policies have contributed to the reversal as certain countries may be seeing a resurgence of growth while the U.S. slows down from high levels.
Regardless of the reasoning, it may be interesting to see which countries have been the winners in 2025 and by how much:
- International at The Top. It’s fascinating that 36 countries beat the U.S. What’s even more staggering is that 19 of them had returns over 40%. Not to mention 11 with returns over 60%! Another interesting observation: The best performers are not concentrated in emerging markets (China, Brazil, etc.) or developed markets (Canada, Germany, etc.) but spread across the globe.
- U.S. at The Bottom. While the U.S. is near the bottom, it’s not in last place. There are 10 countries with worse returns, which puts the U.S. in about the 22nd percentile. More importantly, there are five countries with negative returns! So remember, it could be worse.
- Diversification Wins. Looking across the globe, you will find that each country has its unique characteristics, including policies, specializations and cycles. Nobody knows which country will outperform or when. The most important aspect of investing is diversification, so why not invest in all the countries, ensuring you participate in those unique opportunities, domestically and abroad.
Stay diversified, my friends.
Country Returns
2025 Index Returns
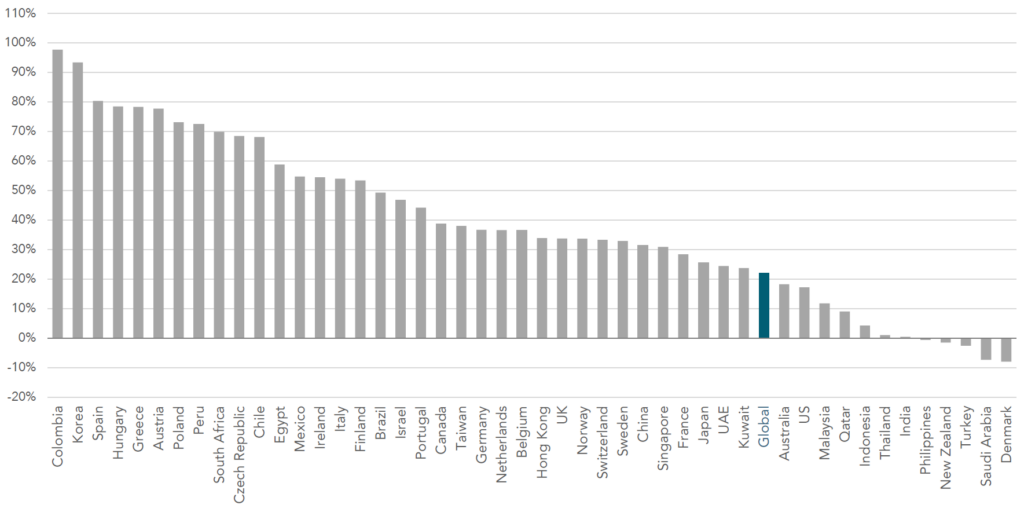
Source: Dimensional Fund Advisors (DFA). Past performance is not a guarantee of future results. Country returns are the country component indices of the MSCI All Country World IMI Index for all countries except the United States, where the Russell 3000 Index is used instead. Global is the return of the MSCI All Country World IMI Index. MSCI index returns are net dividend. Indices are not available for direct investment. Their performance does not reflect the expenses associated with the management of an actual portfolio. Frank Russell Company is the source and owner of the trademarks, service marks and copyrights related to the Russell Indexes. MSCI data © MSCI 2026, all rights reserved.
As always, Dynamic recommends staying balanced, diversified and invested. Despite short-term market pullbacks, it’s more important than ever to focus on the long-term, improving the chances for investors to reach their goals.
Should you need help navigating client concerns, don’t hesitate to reach out to Dynamic’s Asset Management team at (877) 257-3840, ext. 4 or assetmanagement@dynamicadvisorsolutions.com.
Disclosures
This commentary is provided for informational and educational purposes only. The information, analysis and opinions expressed herein reflect our judgment and opinions as of the date of writing and are subject to change at any time without notice. This is not intended to be used as a general guide to investing, or as a source of any specific recommendation, and it makes no implied or expressed recommendations concerning the manner in which clients’ accounts should or would be handled, as appropriate strategies depend on the client’s specific objectives.
This commentary is not intended to constitute legal, tax, securities or investment advice or a recommended course of action in any given situation. Investors should not assume that investments in any security, asset class, sector, market, or strategy discussed herein will be profitable and no representations are made that clients will be able to achieve a certain level of performance, or avoid loss.
All investments carry a certain risk and there is no assurance that an investment will provide positive performance over any period of time. Information obtained from third party resources are believed to be reliable but not guaranteed as to its accuracy or reliability. These materials do not purport to contain all the relevant information that investors may wish to consider in making investment decisions and is not intended to be a substitute for exercising independent judgment. Any statements regarding future events constitute only subjective views or beliefs, are not guarantees or projections of performance, should not be relied on, are subject to change due to a variety of factors, including fluctuating market conditions, and involve inherent risks and uncertainties, both general and specific, many of which cannot be predicted or quantified and are beyond our control. Future results could differ materially and no assurance is given that these statements or assumptions are now or will prove to be accurate or complete in any way.
Past performance is not a guarantee or a reliable indicator of future results. Investing in the markets is subject to certain risks including market, interest rate, issuer, credit and inflation risk; investments may be worth more or less than the original cost when redeemed.
Investment advisory services are offered through Dynamic Advisor Solutions, LLC, dba Dynamic Wealth Advisors, an SEC registered investment advisor.
Photo: Adobe Stock