

Download the 8.22.25 Dynamic Market Update for advisors’ use with clients
By Kostya Etus, CFA®, Chief Investment Officer, Dynamic Asset Management
Guess what the market has been up to? More all-time highs last week for the S&P 500. Positive sentiment was primarily driven by renewed expectations for the Federal Reserve (Fed) to cut interest rates at their upcoming September 17 meeting.
The S&P 500 is now up close to 11% for the year, which is great on an absolute basis, but pales in comparison to the phenomenal international markets run of 22% (year-to-date through Aug. 18, 2025). Most importantly, increased rate cut expectations have led to a relative outperformance of the beaten up small-cap and value stock asset classes last week, potentially foreshadowing a broader market leadership change as the Fed moves into easing mode after a seven-month hiatus. Overall, it continues to be a good year for diversified portfolios allocated to a variety of asset classes.
The shift to further Fed easing has been fueled by recent favorable economic data, including the following key factors:
- Inflation Softening. The biggest news of the week came from the Bureau of Labor Statistics (BLS), reporting the highly anticipated consumer price index (CPI). This key inflation gauge grew by an annual 2.7% in July, slightly below expectations. While core inflation had an increase to 3.1%, a notable component of the report was that tariff-related categories saw minimal impact, a pleasant surprise for investors. Given that the Fed was waiting to see the impact of tariffs on inflation, this stable reading provided favorable sentiment toward the Fed’s upcoming decision of whether to cut rates in September.
- Labor Softening. As we discussed a couple weeks ago, the relatively weak July report and downward revisions for previous months have provided a runway for an “insurance” cut next month. There are two types of rate cuts, ones that happen in anticipation of an economic slowdown (insurance) and those driven by a recession (reactive). In an ideal world, the Fed would be able to cut interest rates methodically as the economy slows, which would spark a resurgence of economic activity (i.e., more jobs) and help to avoid a severe recession.
- Consumer Softening. Other notable releases last week were the U.S. Census Bureau reporting a decrease in retail sales in July while the University of Michigan’s Consumer Sentiment report also came in below expectations. Aside from the labor market, consumer spending is a foundational component to stable economic growth. With slowdowns in both areas, the Fed has yet more reasons to consider September as the right time to re-initiate interest rate cuts.
Looking forward, all eyes will be on key upcoming economic data reports, given there is another inflation and jobs report before the September Fed meeting. The data will hopefully provide clarity on what to expect in September and beyond. Could we see more cuts in October and December, or could we get a surprise “double cut” in September? Time will tell, but ultimately the “Fed getting off the sidelines” rhetoric is supportive for the markets going into the later innings of 2025.
Don’t Worry About Bonds
There are enough things to worry about; your bond allocations shouldn’t be one of them. Bonds got a bad rep in 2022 when they fell in line with stocks. Traditionally, bonds tend to have an inverse relationship with stocks, particularly in market downturns, providing an important ballast in diversified portfolios. One argument is that 2022 was a unique situation given extreme levels of inflation. But has the situation changed now that we’re back to more normal inflation levels?
Well, we almost fell into a bear market this year as the S&P 500 fell about 19% between Feb. 19 and April 8, 2025. What did bonds do during this period? The Bloomberg U.S. Agg provided a calm and stable positive 1% return. Bonds did exactly what bonds are supposed to do.
But how rare is what happened in 2022, and how do bonds typically behave in a market downturn? Looking back through history to 1928, there have been 12 double-digit loss years for the S&P 500. They’re listed below along with bond returns for those years. Key observations:
- Stocks vs. Bonds. When we average the 12 years of the worst market drops, we get just over a 22% loss. During those same years, the average bond return was a 3.5% gain (and a couple percent points higher if you remove the 2022 outlier). Also keep in mind, the two strongest bond returns in the table happened during the 2002 tech bubble and the 2008 global financial crisis. These relatively recent events highlight the powerful combination and diversification benefit of mixing stocks and bonds.
- Is 2022 an Outlier? There were three instances where both stocks and bonds were negative. Two of those still maintained a double-digit difference between stock returns. Thus, 2022 does appear to be a unique situation, but could it happen again? Of course, anything is possible in the markets. But the data would suggest probabilities are in favor of bonds protecting stocks during years with significant market drops.
- Win By Losing Less. One important note: The bond return in 2022 was the worst bond return for a given year on record by a wide margin (the next biggest drop was down 11%). That said, if you combine stocks and bonds in a 60/40 split, like many diversified portfolios do, you will notice the losses of the stock market average almost cut in half (whether 2022 is included or not). By not losing as much in those tumultuous years, investors are able to have downside protection and less ground to make up on the way back up. This ultimately offers a smoother ride over the long-term and is the key benefit of diversification.
P.S. I’d like to give a special shout-out to New York University professor Aswath Damodoran. He offers a variety of free investment tools available to the public, one of which happens to be annual index performance data back to 1928 for various asset classes, which I often use to source research like the table below.
Stay diversified, my friends.
The Worst Years for Stocks
S&P 500 and U.S. Treasury Bond 10-Year Total Returns from 1928
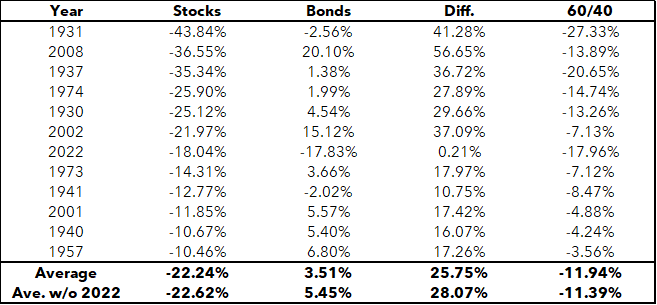
Sources: Historical Returns on Stocks, Bonds and Bills: 1928-2024. Created by Aswath Damodaran, adamodar@stern.nyu.edu. Stocks represented by S&P 500 Index Total Return and Bonds represented by U.S. Treasury Bond (10-year). Past performance is not a reliable indicator of future results.
As always, Dynamic recommends staying balanced, diversified and invested. Despite short-term market pullbacks, it’s more important than ever to focus on the long-term, improving the chances for investors to reach their goals.
Should you need help navigating client concerns, don’t hesitate to reach out to Dynamic’s Asset Management team at (877) 257-3840, ext. 4 or assetmanagement@dynamicadvisorsolutions.com.
Disclosures
This commentary is provided for informational and educational purposes only. The information, analysis and opinions expressed herein reflect our judgment and opinions as of the date of writing and are subject to change at any time without notice. This is not intended to be used as a general guide to investing, or as a source of any specific recommendation, and it makes no implied or expressed recommendations concerning the manner in which clients’ accounts should or would be handled, as appropriate strategies depend on the client’s specific objectives.
This commentary is not intended to constitute legal, tax, securities or investment advice or a recommended course of action in any given situation. Investors should not assume that investments in any security, asset class, sector, market, or strategy discussed herein will be profitable and no representations are made that clients will be able to achieve a certain level of performance, or avoid loss.
All investments carry a certain risk and there is no assurance that an investment will provide positive performance over any period of time. Information obtained from third party resources are believed to be reliable but not guaranteed as to its accuracy or reliability. These materials do not purport to contain all the relevant information that investors may wish to consider in making investment decisions and is not intended to be a substitute for exercising independent judgment. Any statements regarding future events constitute only subjective views or beliefs, are not guarantees or projections of performance, should not be relied on, are subject to change due to a variety of factors, including fluctuating market conditions, and involve inherent risks and uncertainties, both general and specific, many of which cannot be predicted or quantified and are beyond our control. Future results could differ materially and no assurance is given that these statements or assumptions are now or will prove to be accurate or complete in any way.
Past performance is not a guarantee or a reliable indicator of future results. Investing in the markets is subject to certain risks including market, interest rate, issuer, credit and inflation risk; investments may be worth more or less than the original cost when redeemed.
Investment advisory services are offered through Dynamic Advisor Solutions, LLC, dba Dynamic Wealth Advisors, an SEC registered investment advisor.
Photo: Adobe Stock