

Download the 09.18.26 Dynamic Market Update for advisors’ use with clients
By Kostya Etus, CFA®, Chief Investment Officer, Dynamic Asset Management
We’ve had a choppy stock market over the past month on the back of renewed geopolitical tensions in the Middle East, surging bond yields, inflation concerns, AI uncertainty, as well as seasonal headwinds. Let’s unpack some key headlines:
- Oil is back up to more than $100 a barrel, the highest levels since mid-May. Energy prices shot up as fighting between the U.S. and Iran escalated, threatening to disrupt the global supplies of oil.
- 10-year U.S. Treasury yields rose to over 5% for the first time since 2007. In addition to the spike in energy prices, a couple reports reflected persistently elevated inflation. This sent rates higher in anticipation of interest rate hikes from the Federal Reserve (Fed). Mortgage rates were similarly impacted, with the 30-year fixed-rate reaching over 7%, weighing further on the slumped residential real estate market.
- The Fed hiked rates for the first time in three years. The benchmark interest rate was increased by 0.25% to a range of 3.75-4.00%. Policy makers voted unanimously (12-0) in favor of the increase, with Fed Chair Kevin Warsh citing that elevated inflation, strong labor market and geopolitical concerns all contributed to the decision. The committee also provided their expectations for future rates (“dot plot”), signaling potentially another rate hike before year-end, but then holding steady through 2027. Additionally, rate hikes were not a U.S. phenomenon, the European Central Bank (ECU) as well as the Bank of Japan (BOJ) increased their policy rates, with the BOJ rate now at a 30-year high, pushing up interest rates across the globe.
Despite the headlines, the U.S. market is up nearly 12% year-to-date through Sept. 15, 2026 (as measured by the S&P 500). Meanwhile, other notable asset classes continue to shine with small-cap stocks and international markets providing superior returns. Balanced, diversified portfolios are weathering the storm well in 2026.
In terms of what to expect moving forward, let’s review some of the key data points which may be driving the markets:
- Strong Economy. The non-farm payroll report from the U.S. Bureau of Labor Statistics (BLS) showed that the U.S. economy added 162,000 jobs in August 2026. That is not only the highest increase in five months, but also marks a trend reversal as the monthly figures have declined consecutively in the last four reports. Furthermore, the unemployment rate remained unchanged at 4.1%, the lowest level since June 2025. The reversal in the labor market represents a strengthening and resiliency of the economy and provides a strong backbone to be able to withstand an increase in interest rates.
- Stable Inflation. The Consumer Price Index (CPI) was also delivered by the BLS showing a 3.4% inflation rate for August. While this is the same rate as the previous month, Core CPI (which excludes the more volatile food and energy prices) dropped to 2.4%. While these figures were in line with expectations, the fear was that they are above the 2% target the Fed prefers. Although the rate remains elevated, it is reassuring that it’s relatively stable and has meaningfully and consistently come down since May.
- Stellar Earnings. Of all the metrics recently released, I saved the best for last. According to Factset, the S&P 500 year-over-year earnings growth for the second quarter of 2026 came in at a staggering 52%. First off, this is the strongest quarter of growth that we have seen since the post-pandemic recovery in early 2021. Secondly, this is the seventh consecutive quarter of double-digit earnings growth. Lastly, third quarter earnings growth is currently projected to be nearly 29%. So, while external forces (rates, inflation, geopolitics) are making noise, companies are quietly growing their earnings at record levels, providing a key pillar for support for the stock market.
As mentioned, we are currently going through a seasonally weaker period for the stock market. Not to mention the uncertainty being presented by the mid-term elections. So, there may be some volatility still to be had in the near-term. But as we get past the hump and into the holiday months, the skies may open as investors re-focus on what really drives market returns… read on to find out.
What Really Drives the Markets?
Looking back over the past 10 years, we have had sensational market moving events, including Brexit, China trade war, COVID-19 pandemic, post-pandemic inflation surge and Fed rate hikes, AI boom, Russian invasion of Ukraine — to name a few. And yet, over that 10-year period, the U.S. stock market (S&P 500) has managed to achieve returns of more than 15% per year. On a cumulative basis, that’s over a 300% return over that period, meaning an investor would have quadrupled their money! How is this possible, and how does the market continue to grind higher over time?
To answer that question, the chart below shows the price of the S&P 500 over the past 10 years compared to earnings growth of the companies within the S&P 500:
- Voting vs. Weighing Machine. A famous quote from legendary investor Ben Graham states that “In the short run, the market is a voting machine, but in the long run, it is a weighing machine.” The voting machine represents short-term market noise, as stock prices bounce around based on a popularity contest, reacting to dramatic headlines, fear and knee-jerk reactions. The weighing machine means that in the long-term, the market removes emotions and weighs the fundamental drivers of returns to determine where prices should be.
- Fundamentals. The fundamental drivers of returns focus on the underlying financial structure of companies, including earnings, cash slows, profit margins, debt, valuation multiples, etc. But if you strip down any company to its essentials, the main thing long-term investors care about (and thus what the market cares about) is how much money companies are making.
- Investing for the Long-Term. As the chart shows, over the past 10 years, earnings have steadily increased, albeit with some volatility. That said, it is nowhere near the volatility exhibited by the market price (blue line). The price moves round the earnings line wildly, often with strong spikes up and down, as it is susceptible to short-term noise. But if you re-focus your eyes and look at the full picture, you will notice that despite the path to get here, both earnings and price start and end in about the same place. This would be the case if you looked over the last 20, 50 or even 100 years. Staying invested and diversified for the long-term, while ignoring the short-term noise, is the best way to achieve your investment goals.
Stay diversified, my friends.
Market Earnings vs. Price
S&P 500 Change in Trailing 12-Month EPS vs. Change in Price: 10 Years
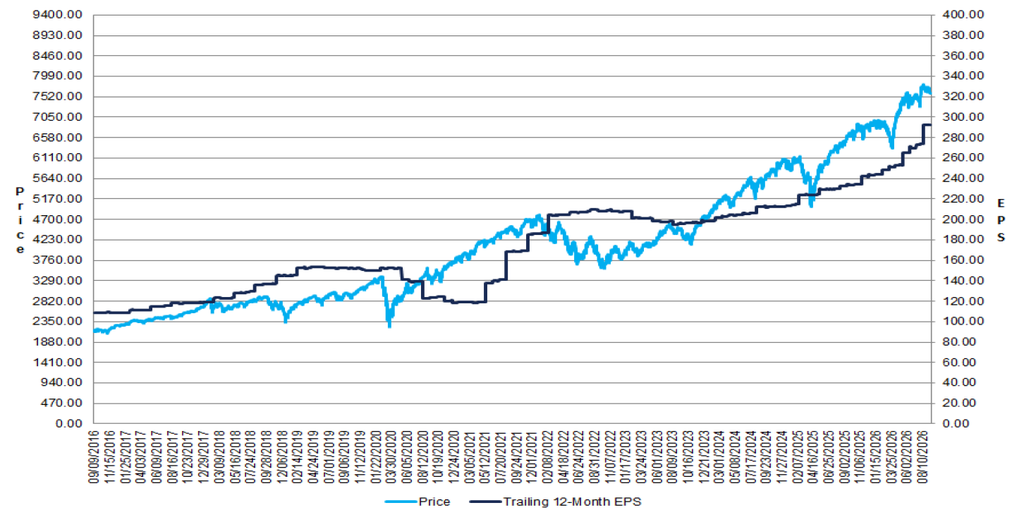
Source: FactSet Earnings Insight, 9/11/2026.
As always, Dynamic recommends staying balanced, diversified and invested. Despite short-term market pullbacks, it’s more important than ever to focus on the long-term, improving the chances for investors to reach their goals.
Should you need help navigating client concerns, don’t hesitate to reach out to Dynamic’s Asset Management team at (877) 257-3840, ext. 4 or investmentmanagement@dynamicadvisorsolutions.com.
Disclosures
This commentary is provided for informational and educational purposes only. The information, analysis and opinions expressed herein reflect our judgment and opinions as of the date of writing and are subject to change at any time without notice. This is not intended to be used as a general guide to investing, or as a source of any specific recommendation, and it makes no implied or expressed recommendations concerning the manner in which clients’ accounts should or would be handled, as appropriate strategies depend on the client’s specific objectives.
This commentary is not intended to constitute legal, tax, securities or investment advice or a recommended course of action in any given situation. Investors should not assume that investments in any security, asset class, sector, market, or strategy discussed herein will be profitable and no representations are made that clients will be able to achieve a certain level of performance, or avoid loss.
All investments carry a certain risk and there is no assurance that an investment will provide positive performance over any period of time. Information obtained from third party resources are believed to be reliable but not guaranteed as to its accuracy or reliability. These materials do not purport to contain all the relevant information that investors may wish to consider in making investment decisions and is not intended to be a substitute for exercising independent judgment. Any statements regarding future events constitute only subjective views or beliefs, are not guarantees or projections of performance, should not be relied on, are subject to change due to a variety of factors, including fluctuating market conditions, and involve inherent risks and uncertainties, both general and specific, many of which cannot be predicted or quantified and are beyond our control. Future results could differ materially and no assurance is given that these statements or assumptions are now or will prove to be accurate or complete in any way.
Past performance is not a guarantee or a reliable indicator of future results. Investing in the markets is subject to certain risks including market, interest rate, issuer, credit and inflation risk; investments may be worth more or less than the original cost when redeemed.
Investment advisory services are offered through Dynamic Advisor Solutions, LLC, dba Dynamic Wealth Advisors, an SEC registered investment advisor.
Photo: Adobe Stock