

Download the 10.16.26 Dynamic Market Update for advisors’ use with clients
By Kostya Etus, CFA®, Chief Investment Officer, Dynamic Asset Management
After a relatively flat August and September, the market is back to setting new, all-time highs in October (as measured by the S&P 500). Year-to-date through October 13, we are up more than 15%. Much of the recent market success has been driven by oil price stabilization, elevated earnings expectations and perhaps most importantly, by lower expectations for interest rate hikes by the Federal Reserve (Fed).
Oil prices, while still elevated at over $90 per barrel, but have come down meaningfully from the $105 highs we saw in September and have been trading with less volatility over the past couple weeks. Elsewhere, the latest Wall Street analyst expectations for third-quarter earnings growth are nearly 30%. If realized, it would mark the third consecutive quarter of growth over 25%. Lastly, after seeing the 10-year Treasury yield reach a whopping 5.35% in early October, the highest level since 2002, we have seen rates come back in as the latest data supports a less restrictive Fed.
Let’s take a closer look at this data:
- Mixed Inflation. To start the month, we had a healthy Personal Consumption Expenditures (PCE) reading with year-over-year inflation growth of 3.4% for August, well below expectations. Similarly, Core PCE (which excludes the more volatile food and energy prices and is the preferred measure of the Fed) was at 3.0%, again below expectations. Furthermore, previous month readings were revised lower. More recently, the tables turned as another key measure of inflation, Consumer Price Index (CPI), was reported at 3.7% annual growth for September (driven primarily by energy prices), with Core CPI at 2.6%, both above expectations and previous monthly levels.
- Lower Labor. U.S. non-farm payrolls, the primary measure for labor growth, showed the addition of 29,000 jobs in September, well below expectations of 90,000 and well below the previous month’s downwardly revised 133,000. Meanwhile, the U.S. unemployment rate, measuring the health of the labor market, increased to 4.2% in September, up from the previous month and above expectations. Both signals indicate a potential slowdown in the labor market, albeit not a meaningful deterioration.
- Fed Expectations. The Fed is less likely to increase rates if inflation remains low and the labor market is struggling. Thus, given the data above, the market implied rate expectations have been quite volatile. About a month ago, expectations were more than 40% for an additional rate hike at the next Fed meeting in late October. After the PCE inflation and labor reports were released, expectations for a hike dropped, indicating over 80% for no change. And after the latest CPI inflation report, we are sitting just above a 30% change for a hike. While we may avoid a hike in October, the recently released minutes from the last Fed meeting indicate the anticipation of another potential rate hike at some point before year-end.
We will need to await more data to make a better determination about the future of interest rates. But in the meantime, the market may continue to take advantage of relative geopolitical stability and potentially strong earnings. Not to mention the entrance into the holiday season, which tends to favor the stock market.
The Market Breadth Evolution
We know that the market has been fairly concentrated in the previous few years. Meaning that a relatively small number of companies have been responsible for most of the growth in the market. The outperformance has been primarily driven by the artificial intelligence (AI) boom and the mega-cap technology growth stocks that benefitted. This has resulted in fewer companies representing a larger portion of the market itself. This has increased the risk inherent in the market because if any of those large companies have meaningful pullbacks, they take a larger chunk of the market down with them, causing a potential market correction.
But as AI becomes more mainstream and valuations become stretched for the companies at the top, a regime change begins to emerge. A great rotation of sorts, where smaller companies begin to reap the benefits of AI and grow their profits, thereby increasing stock prices. Meanwhile the tech giants are struggling to keep up with lofty earnings expectations and may start to come down to planet earth in terms of stock prices.
But how can we evaluate the amount of broadening happening in the market leadership? One way is to look at what percentage of stocks within the S&P 500 are beating the index itself (chart below). Let’s review the key insights:
- The Last Three Years. The period from 2023-2025 has some of the lowest percentages of companies beating the index that we have ever seen, at least since 1995. In 2023, we had the launch of AI, which gave rise to the Magnificent 7, carrying the bulk of the index for nearly three years, and leaving the other 493 stocks behind. But finally, in 2026, we are seeing a broadening into other areas of the market, with more companies starting to outperform the index.
- We’ve Seen This Before. The last time we saw such a narrow leadership was in the late 1990s… remember the Tech Bubble? And that period was followed by a fairly sharp multi-year broadening in market participation (blue bars represent leadership of more than 50%). Such a shift could be underway today, with 46% beating the index in the first half of 2026. This is a great reminder that just like anything else in the markets, there is cyclicality present. If you average all the years on the chart, you get about 47%. Thus, when the percentage falls well below, there’s a natural tendency to eventually spring back up.
- Diversification Protects from Concentration. The best way to defend from concentration, cyclicality and corrections is through diversification. By allocating beyond the top seven companies, beyond the technology sector, beyond mega-cap growth stocks, and even beyond the S&P 500 – you can dampen an adverse shift in any one area of the market and protect your portfolio and your wealth. Staying diversified and invested for the long-term is the best way to reach your investment goals.
Stay diversified, my friends.
Percentage of S&P 500 Index Members Outperforming the Index
1995 – 1H 2026
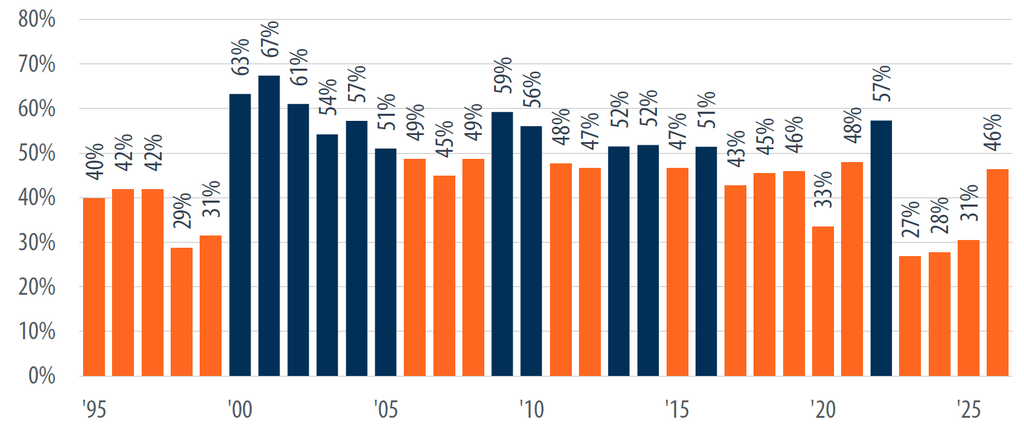
Source: Capital IQ, First Trust Advisors. Data from 12/30/95-6/30/26.
As always, Dynamic recommends staying balanced, diversified and invested. Despite short-term market pullbacks, it’s more important than ever to focus on the long-term, improving the chances for investors to reach their goals.
Should you need help navigating client concerns, don’t hesitate to reach out to Dynamic’s Asset Management team at (877) 257-3840, ext. 4 or investmentmanagement@dynamicadvisorsolutions.com.
Disclosures
This commentary is provided for informational and educational purposes only. The information, analysis and opinions expressed herein reflect our judgment and opinions as of the date of writing and are subject to change at any time without notice. This is not intended to be used as a general guide to investing, or as a source of any specific recommendation, and it makes no implied or expressed recommendations concerning the manner in which clients’ accounts should or would be handled, as appropriate strategies depend on the client’s specific objectives.
This commentary is not intended to constitute legal, tax, securities or investment advice or a recommended course of action in any given situation. Investors should not assume that investments in any security, asset class, sector, market, or strategy discussed herein will be profitable and no representations are made that clients will be able to achieve a certain level of performance, or avoid loss.
All investments carry a certain risk and there is no assurance that an investment will provide positive performance over any period of time. Information obtained from third party resources are believed to be reliable but not guaranteed as to its accuracy or reliability. These materials do not purport to contain all the relevant information that investors may wish to consider in making investment decisions and is not intended to be a substitute for exercising independent judgment. Any statements regarding future events constitute only subjective views or beliefs, are not guarantees or projections of performance, should not be relied on, are subject to change due to a variety of factors, including fluctuating market conditions, and involve inherent risks and uncertainties, both general and specific, many of which cannot be predicted or quantified and are beyond our control. Future results could differ materially and no assurance is given that these statements or assumptions are now or will prove to be accurate or complete in any way.
Past performance is not a guarantee or a reliable indicator of future results. Investing in the markets is subject to certain risks including market, interest rate, issuer, credit and inflation risk; investments may be worth more or less than the original cost when redeemed.
Investment advisory services are offered through Dynamic Advisor Solutions, LLC, dba Dynamic Wealth Advisors, an SEC registered investment advisor.
Photo: Adobe Stock