

Download the 11.11.22 Dynamic Market Update for advisors’ use with clients
By Kostya Etus, CFA®, Head of Strategy, Dynamic Investment Management
The Markets Hate Uncertainty
Market participants tend to be very skittish and like to panic. Oftentimes, the worst of outcomes are already priced in. This is why any type of resolution or clarity can clear up the skies and allow the sun to shine. Below are three key events of the past two weeks and their impact on uncertainty:
- Mid-Term Elections: Uncertainty Clearing. Specific election results are not as important of a consideration for the markets. But the market does like the removal of uncertainty about the results. Expectations were for a split government, meaning no major federal legislation could be enacted unless it got significant bipartisan support. This could have been supportive of a market rally going into yearend. Unfortunately, initial results are unclear about the control of Congress, so there may still be uncertainty looming.
- Jobs: Uncertainty Clearing. Nonfarm payrolls rose by 261K, above expectations, showing continued job growth and a strong economy. Wage inflation, on the other hand, has fallen to 4.7%. Moderating wage growth may be an important indicator of inflation starting to come down.
- Rates: Uncertainty Persists. The Federal Reserve (Fed) hiked the federal funds rate by another 0.75% to a range of 3.75% to 4.00%. The Fed’s messaging remained focused on controlling inflation and the potential for continued rate increases into 2023. Risk of overtightening the economy remains.
BONUS! Inflation: Uncertainty Clearing. The Consumer Price Index (CPI), a key measure of inflation, rose by 7.7% over the last year, the lowest increase since January and below expectations. This could be a sign that inflation is peaking and increases the chances of the Fed being less aggressive with rate hikes, which would all be beneficial for the markets.
If Everything in Your Portfolio is Working, You’re Not Diversified!
When it comes to investing, there are things we can control and things we can’t. We can’t control what the stock market will do, nor can we predict it. But we can control how diversified our investment portfolios are.
Take a look at the “Asset Class Returns” Callan chart below, also known as a quilt chart. It shows the performance of various broad asset classes each year, dating back to 2007. It also includes an Asset Allocation portfolio (white boxes) as a combination of all the asset classes. Here are some key things that stand out:
- All asset classes experience volatility in returns. Notice REITs over the past several years. Top performer in 2019, worst in 2020, top again in 2021 and worst again in 2022 YTD. Being invested in any one asset class would create wild swings in portfolio returns.
- But asset classes don’t exhibit the same cyclicality. Each asset class has a certain period in which it does well and another in which it does poorly. For example, in the last four years, whenever REITs have done poorly, Fixed Income has performed relatively well, and vice versa.
- Staying balanced and diversified helps to smooth out returns. Being allocated to a variety of asset classes lowers the overall portfolio volatility and offers a smoother ride. Looking at the aggregated data in the right two columns, we see that being allocated to a diversified portfolio results in above average returns while maintaining a relatively low level of volatility.
Asset Class Returns
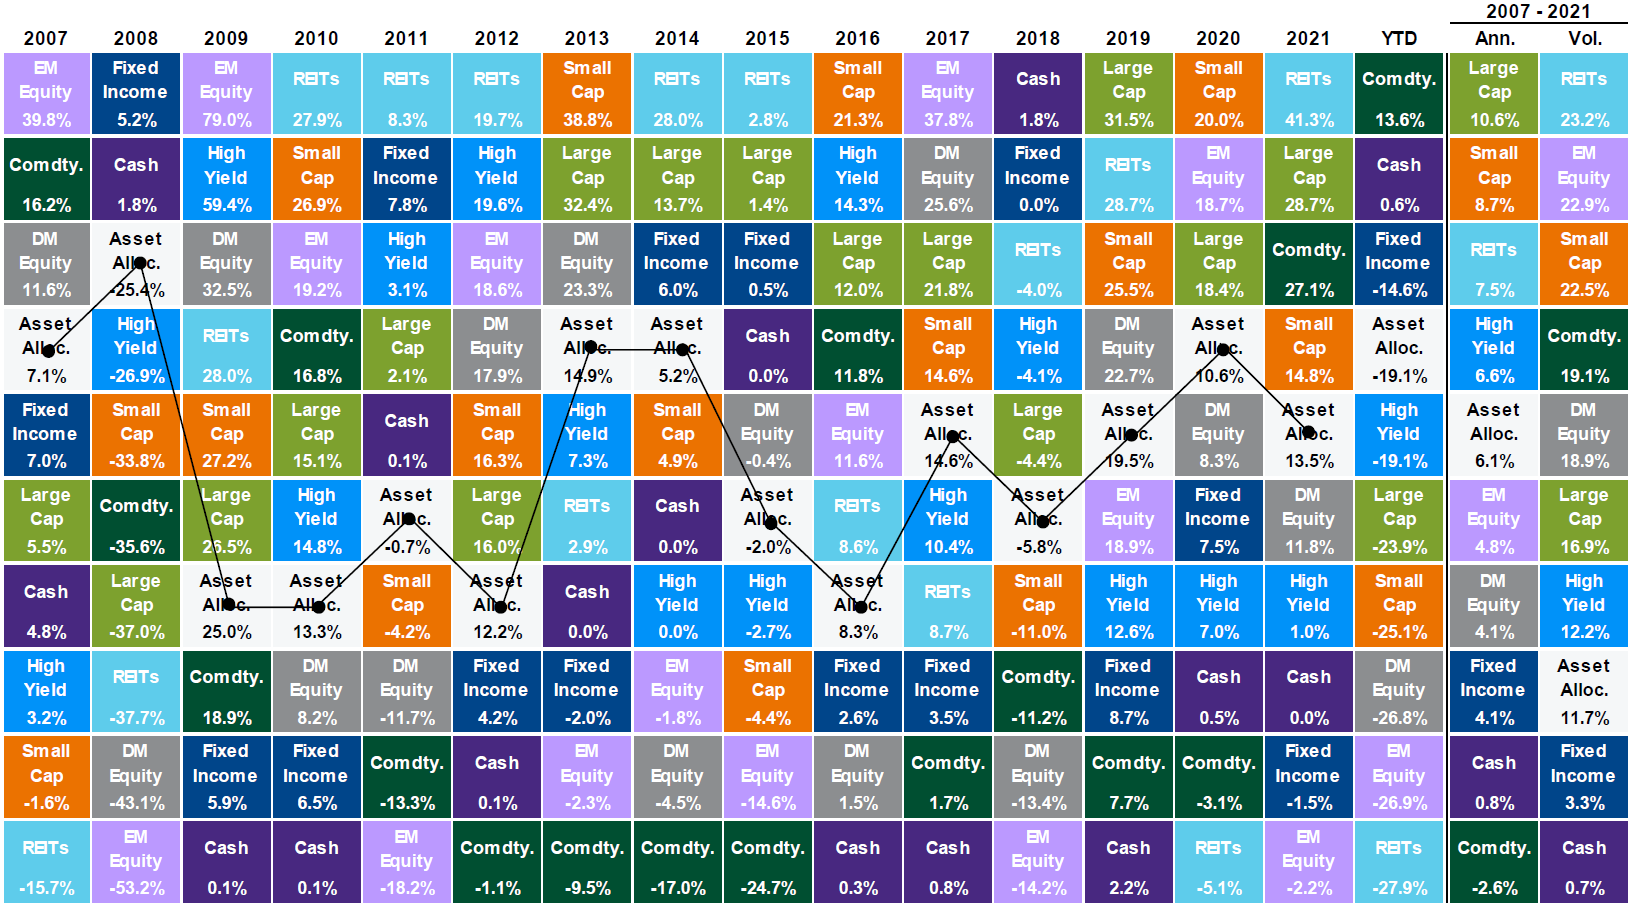
Source: Bloomberg, FactSet, MSCI, NAREIT, Russell, Standard & Poor’s, J.P. Morgan Asset Management.
Large cap: S&P 500, Small cap: Russell 2000, EM Equity: MSCI EME, DM Equity: MSCI EAFE, Comdty: Bloomberg Commodity Index, High Yield: Bloomberg Global HY Index, Fixed Income: Bloomberg US Aggregate, REITs: NAREIT Equity REIT Index, Cash: Bloomberg 1-3m Treasury. The “Asset Allocation” portfolio assumes the following weights: 25% in the S&P 500, 10% in the Russell 2000, 15% in the MSCI EAFE, 5% in the MSCI EME, 25% in the Bloomberg US Aggregate, 5% in the Bloomberg 1-3m Treasury, 5% in the Bloomberg Global High Yield Index, 5% in the Bloomberg Commodity Index and 5% in the NAREIT Equity REIT Index. Balanced portfolio assumes annual rebalancing. Annualized (Ann.) return and volatility (Vol.) represents period from 12/31/2006 to 12/31/2021. Please see disclosure page at end for index definitions. All data represents total return for stated period. The “Asset Allocation” portfolio is for illustrative purposes only. Past performance is not indicative of future returns. Guide to the Markets – U.S. Data are as of September 30, 2022.
As always, Dynamic recommends staying balanced, diversified and invested. Despite short-term market pullbacks, it’s more important than ever to focus on the long-term, improving the chances for investors to reach their goals.
Should you need help navigating client concerns, don’t hesitate to reach out to Dynamic’s Investment Management team at (877) 257-3840, ext. 4 or investmentmanagement@dynamicadvisorsolutions.com.
Disclosures
This commentary is provided for informational and educational purposes only. The information, analysis and opinions expressed herein reflect our judgment and opinions as of the date of writing and are subject to change at any time without notice. This is not intended to be used as a general guide to investing, or as a source of any specific recommendation, and it makes no implied or expressed recommendations concerning the manner in which clients’ accounts should or would be handled, as appropriate strategies depend on the client’s specific objectives.
This commentary is not intended to constitute legal, tax, securities or investment advice or a recommended course of action in any given situation. Investors should not assume that investments in any security, asset class, sector, market, or strategy discussed herein will be profitable and no representations are made that clients will be able to achieve a certain level of performance, or avoid loss.
All investments carry a certain risk and there is no assurance that an investment will provide positive performance over any period of time. Information obtained from third party resources are believed to be reliable but not guaranteed as to its accuracy or reliability. These materials do not purport to contain all the relevant information that investors may wish to consider in making investment decisions and is not intended to be a substitute for exercising independent judgment. Any statements regarding future events constitute only subjective views or beliefs, are not guarantees or projections of performance, should not be relied on, are subject to change due to a variety of factors, including fluctuating market conditions, and involve inherent risks and uncertainties, both general and specific, many of which cannot be predicted or quantified and are beyond our control. Future results could differ materially and no assurance is given that these statements or assumptions are now or will prove to be accurate or complete in any way.
Past performance is not a guarantee or a reliable indicator of future results. Investing in the markets is subject to certain risks including market, interest rate, issuer, credit and inflation risk; investments may be worth more or less than the original cost when redeemed.
Investment advisory services are offered through Dynamic Advisor Solutions, LLC, dba Dynamic Wealth Advisors, an SEC registered investment advisor.
Photo: Element5 Digital, Unsplash