

By Kostya Etus, CFA®, Head of Strategy, Dynamic Investment Management
Download the 6.17.22 Dynamic Market Update PDF for advisors’ use with clients
What Happened? A 5-Day Timeline
- 6/10/2022: Disappointing Inflation Data – Consumer Price Index (CPI), the primary measure of inflation, rose by 1% over the last month and 8.6% over the last year (primarily fueled by energy prices), the most in more than 40 years and above expectations. The market may have believed that inflation had peaked, leading to a S&P 500 drop of 2.91%.
- 6/13/2022: Negative Market Reaction – After taking the weekend to process the data, fear of a more aggressive rate-hike path and a slowdown in economic growth led to a drop in the S&P 500 of 3.88%, pushing the index into bear market territory (down more than 20% since the highs in early January).
- 6/14/2022: Volatility Before the Storm – A volatile day in the market, which left the ending price just slightly lower on the S&P 500 as the market geared up for the Federal Reserve (Fed) meeting.
- 6/15/2022: Fed Meeting With 75bp Hike – The expectation at the scheduled meeting was originally for a 50bp hike, but revisions for higher inflation data and lower growth lead the decision for a higher hike. S&P 500 was up 1.46% on June 15, perhaps with the hope that the Fed was taking necessary action to curb inflation.
- 6/16/2022: Other Central Banks Follow Suit – The Swiss National Bank announced a surprise 50bp rate hike (the first in 15 years), the Bank of England raised by 25bp and Brazil’s central bank increased its key rate by 50bp. The market reaction shifted to a global recession fear and the S&P 500 fell 3.25%.
Important Market Reminders
- Market Drops Are Normal – The train that is generally moving up a mountain needs to let out some steam now and again to prevent more serious problems. The market may have been overheating towards the end of the year from strong performance post-Covid, and is now releasing some of that pressure by coming down to more stable levels. As a reminder, the S&P 500 was up 31% in 2019, 18% in 2020, and 29% in 2021.As per the “S&P 500 Index 1942-2022” chart below, a market drop of 10% happens just about every year and a drop of 20% happens about every six years. Investors sometimes get comfortable in the good times and forget to expect a bit of market turbulence now and then on their way up the mountain.
- Markets Are Cyclical – Market performance is often overexaggerated on the upside due to excessive expectations and is then overly disappointed as it reverses course. This is why the market is volatile and doesn’t simply move in a straight line. The post-Covid exuberance may have been overdone in 2021, but recent market performance may certainly lead you to believe very unfavorable outcomes in 2022. This means that the market is already pricing in high inflation, high rates, low growth, high food and energy prices, continued geopolitical conflict, Covid driven supply-chain issues, etc. Any potentially favorable or “less bad” news may shift the tide back to the upside.As per the “Average Annualized Returns After Market Decline of More Than 10%” chart below, the forward looking one, three and five-year returns are all close to or above positive double-digit growth.
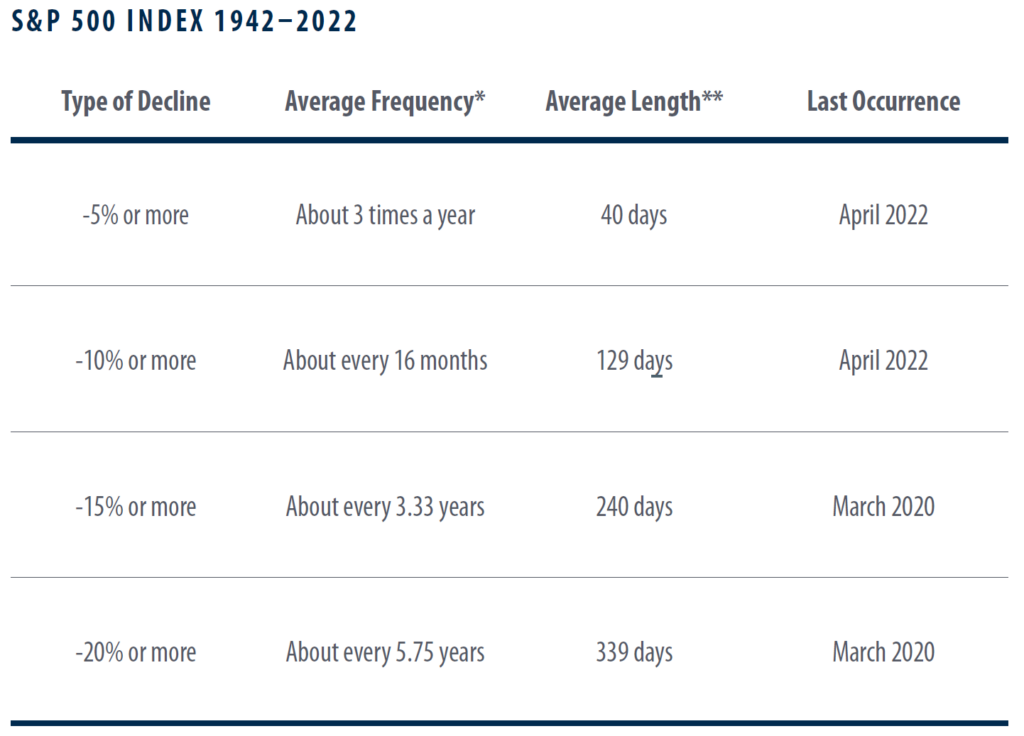
Source: Bloomberg, 4/29/1942 – 4/29/2022. Past performance is no guarantee of future results. For illustrative purposes only and not indicative of any actual investment. Investors cannot invest directly in an index.* Correction cycles are determined by identifying market declines in excess of the minimum declines noted above. The cycle ends when there is a recovery of the magnitude of the minimum decline needed for that correction size (i.e., a recovery of greater than 5%, 10%, 15% or 20%). After that recovery is noted, the algorithm begins searching for the next decline to start the cycle again.
** Measures from the date of the market high to the date of the market low.
The S&P 500 Index is an unmanaged index of 500 companies used to measure large-cap U.S. stock market performance
.
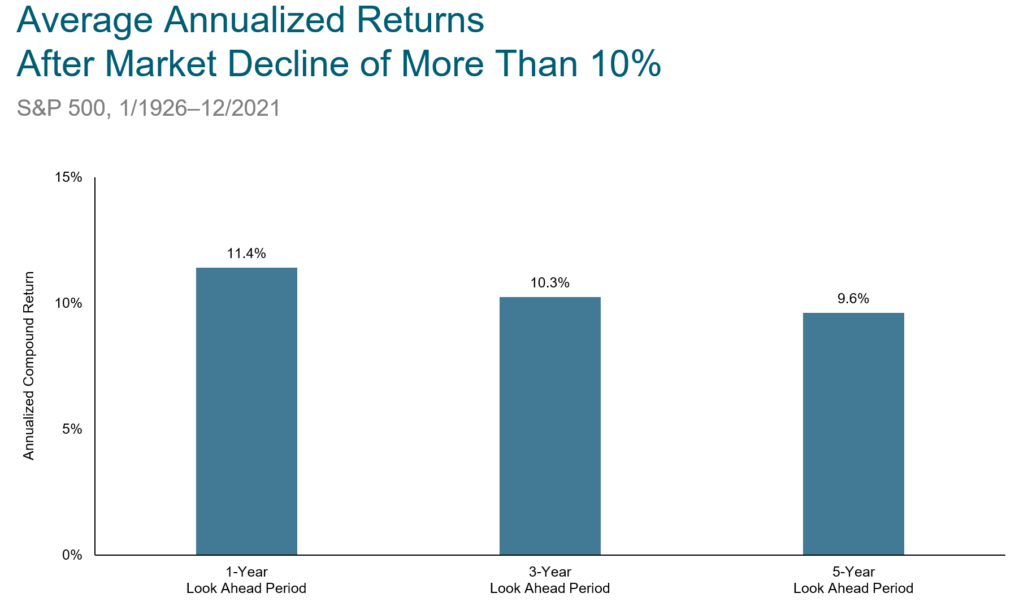
In U.S. dollars. Past performance is no guarantee of future results. Declines are defined as months ending with the market below the previous market high by at least 10%. Annualized compound returns are computed for the relevant time periods after each decline observed and averaged across all declines for the cutoff. There were 1,151 observation months in the sample. January 1990–present: S&P 500 Total Returns Index. S&P data © 2022 S&P Dow Jones Indices LLC, a division of S&P Global. All rights reserved. January 1926–December 1989; S&P 500 Total Return Index, Stocks, Bonds, Bills and Inflation Yearbook™, Ibbotson Associates, Chicago. For illustrative purposes only. Index is not available for direct investment; therefore, its performance does not reflect the expenses associated with the management of an actual portfolio. There is always a risk that an investor may lose money.
As always, Dynamic recommends staying balanced, diversified and invested. Despite short-term market pullbacks, it’s more important than ever to focus on the long-term, improving the chances for investors to reach their goals.
Should you need help navigating client concerns, don’t hesitate to reach out to Dynamic’s Investment Management team at (800) 257-3840, ext. 4 or investmentmanagement@dynamicadvisorsolutions.com.
Photo: Erik Mclean, unsplash
Disclosures
This commentary is provided for informational and educational purposes only. The information, analysis and opinions expressed herein reflect our judgment and opinions as of the date of writing and are subject to change at any time without notice. This is not intended to be used as a general guide to investing, or as a source of any specific recommendation, and it makes no implied or expressed recommendations concerning the manner in which clients’ accounts should or would be handled, as appropriate strategies depend on the client’s specific objectives.
This commentary is not intended to constitute legal, tax, securities or investment advice or a recommended course of action in any given situation. Investors should not assume that investments in any security, asset class, sector, market, or strategy discussed herein will be profitable and no representations are made that clients will be able to achieve a certain level of performance, or avoid loss.
All investments carry a certain risk and there is no assurance that an investment will provide positive performance over any period of time. Information obtained from third party resources are believed to be reliable but not guaranteed as to its accuracy or reliability. These materials do not purport to contain all the relevant information that investors may wish to consider in making investment decisions and is not intended to be a substitute for exercising independent judgment. Any statements regarding future events constitute only subjective views or beliefs, are not guarantees or projections of performance, should not be relied on, are subject to change due to a variety of factors, including fluctuating market conditions, and involve inherent risks and uncertainties, both general and specific, many of which cannot be predicted or quantified and are beyond our control. Future results could differ materially and no assurance is given that these statements or assumptions are now or will prove to be accurate or complete in any way.
Past performance is not a guarantee or a reliable indicator of future results. Investing in the markets is subject to certain risks including market, interest rate, issuer, credit and inflation risk; investments may be worth more or less than the original cost when redeemed.