

Download the 07.17.26 Dynamic Market Update for advisors’ use with clients.
By Kostya Etus, CFA®, Chief Investment Officer, Dynamic Asset Management
We have experienced a relatively flat market to start the second half of the year. The good news is that even with renewed geopolitical tensions in the Middle East, market volatility (as measured by the VIX Index) has been at some of the lowest levels of the year.
Geopolitical uncertainty played a much bigger role earlier in the year, with meaningful drops in the stock market in the first quarter. But recent headlines of U.S.-Iran conflict escalation have been largely ignored by investors, perhaps learning from their mistakes in terms of overreactions to such news. Even oil prices didn’t increase very much, supporting the case for more stable inflation ahead.
Speaking of inflation, the better news is that we received a surprise to the downside on the last reading, pushing markets into the green. Perhaps this was the needed push to break the market out of its lull.
Taking a step back, however, we see that despite the noise, the U.S. stock market (as measured by the S&P 500 Index) is up double digits this year, with over nearly an 11% return (through July 14, 2026). Meanwhile, small-cap stocks maintain their dominance, up almost double at more than 20%. And international markets continue to outperform domestic with over a 13% gain, primarily driven by emerging market leadership, up more than 19%. Finally, real estate has also been a strong performer, nearing a 13% return. All told, it continues to be a great year for diversified portfolios.
With geopolitics and the AI boom stabilizing (as discussed in the June 26 Dynamic Market Update, “A Hawk in Dove’s Clothing”), investors start to take a closer look at economic data to gain insights on what to expect for the second half of the year. Let’s review recent developments and their potential impact on the markets moving forward:
- Inflation Lower than Expected. On July 14, the U.S. Bureau of Labor Statistics (BLS) posted the Consumer Price Index (CPI), a primary measure of the U.S. inflation rate. The annual inflation rate fell to 3.5% for June. This is the first decline in five months, well below the 4.2% in May, and below the consensus economist forecast of 3.8%. While the leading driver was stabilization in energy prices, the drop was also supported by modest easing in shelter costs (a major component of overall inflation). More importantly, Core CPI, which excludes the more volatile food and fuel costs, making it the preferred metric by the Federal Reserve (Fed), fell to 2.6%, also below expectations and previous readings. The news was well received by the markets as investors were worried about the impact of higher inflation on interest rates.
- Job Growth Lower than Expected. On July 2, the BLS also posted the U.S. Non-Farm Payrolls, a leading measure of the health of the labor market. The reading came in at 57,000 new jobs for June, well below the downwardly revised 129,000 in May and well below forecasts of 110,000. While still positive, this is the third consecutive monthly drop in job growth, signaling a slowdown in the labor market. This news was also well received by investors who were worried the economy may be running too hot.
- Interest Rate Expectations Lower. The combination of lower-than-expected inflation and lower-than-expected job growth had a meaningful impact on future interest rate expectations. Given the Fed has a dual mandate of maximum employment and stable prices, the solution to boost job growth is to keep interest rates lower, and the Fed will only be comfortable keeping rates low if inflation is stable. Given our “Goldilocks” scenario over the past couple weeks, market implied expectations for interest rate hikes for the next few Fed meetings have been reduced.
With inflation lower and the labor market showing some signs of weakness, the prospects of rate hikes by the Fed have come down. This bodes well for the markets looking forward. Both businesses and consumers alike favor lower interest rates to support purchases, helping strengthen the economy and financial markets.
Risk is Relative
One of the most common investment concepts is that stocks are riskier than bonds. And this is easily observed on any given day when you compare performance between the two asset classes. But investing is a long-term game and looking at the short term doesn’t always tell the full story.
One of my favorite blogs, “A Wealth of Common Sense,” is written by Ben Carlson, CFA®. He has a great way of taking complex investment concepts and putting them in terms that everyone can understand. He recently published a book, “Risk and Reward: How to handle market volatility and build long-term wealth,” where he features his best ideas on how to simplify investing.
One of the chapters, “Short-Tem vs. Long-Term Volatility,” features a fascinating chart I’ve shared below. It features the risk (standard deviation) of monthly returns for stocks, bonds and cash over various periods. Here are the key insights:
- Short Term: The stock market is very volatile in the short term. A standard deviation of 21% over a one-year period means that if the average annual return for the stock market is 10%, in any given year it will range from positive 31% to negative 11%. But those are average deviations; there are often outliers. For example, the best 12-month return for the S&P 500 over the evaluation period was +163% and the worst was -68% — that’s quite a range! This is often the risk that investors think about and try to diversify with bonds or cash to help dampen the deviations of returns.
- Long Term. As you start looking long term, volatility in the stock market starts to fall drastically, while bond and cash risk remains relatively stable. We often talk about how investing is a long-term game, and it’s best to ignore the short-term noise. This is the data to back it up. Over a 30-year holding period, the stock market is lower risk than bonds or cash! The challenge is that emotions often get in the way of holding through the entire period. As referenced above, losing 68% of your investment value is tough to swallow.
- In the Middle. There is no one-stop solution to investing, and each situation is different. Most investors lie somewhere in the middle. Given volatility is based on investment time frame, that is often a good place to start. The longer your time horizon, the more comfort level to invest more in the stock market. As the time to retirement shortens, the additions of bonds/cash help defend against shorter-term volatility and protects your investment. Ultimately, staying balanced and diversified is the best way to reach your investment goals.
Stay diversified, my friends.
Asset Class Volatility by Holding Period
S&P 500, 5-Year Treasuries, 1-Month T-bills, 1926-2024
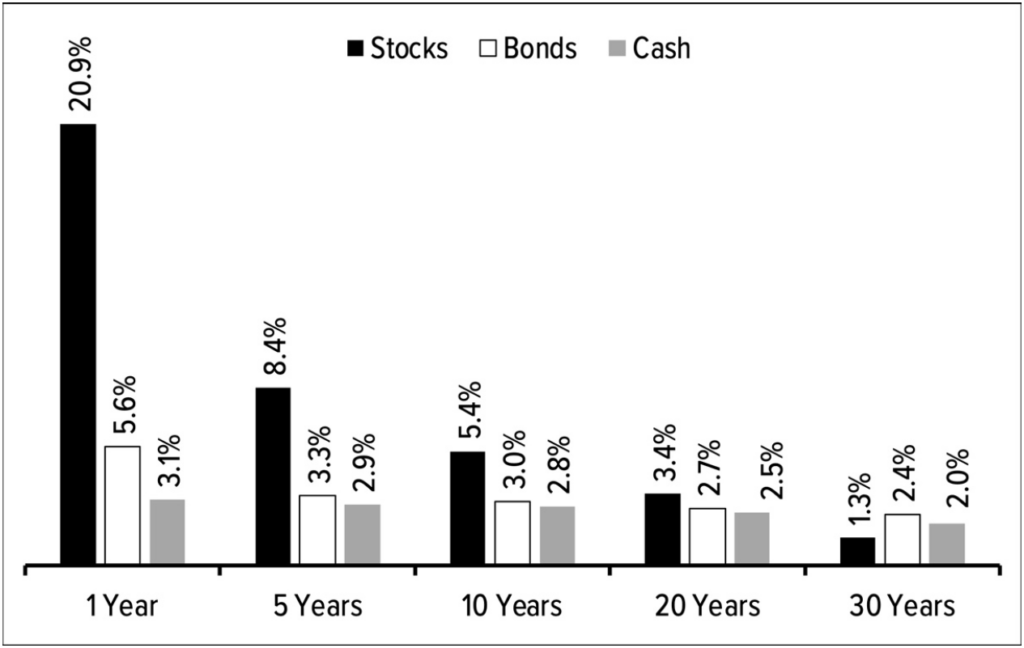
Source: “Risk & Reward: How to handle volatility and build long-term wealth” by Ben Carlson, May 12, 2026. Figure 12.6 on page 113. Source: Returns 2.0.
As always, Dynamic recommends staying balanced, diversified and invested. Despite short-term market pullbacks, it’s more important than ever to focus on the long-term, improving the chances for investors to reach their goals.
Should you need help navigating client concerns, don’t hesitate to reach out to Dynamic’s Asset Management team at (877) 257-3840, ext. 4 or investmentmanagement@dynamicadvisorsolutions.com.
Disclosures
This commentary is provided for informational and educational purposes only. The information, analysis and opinions expressed herein reflect our judgment and opinions as of the date of writing and are subject to change at any time without notice. This is not intended to be used as a general guide to investing, or as a source of any specific recommendation, and it makes no implied or expressed recommendations concerning the manner in which clients’ accounts should or would be handled, as appropriate strategies depend on the client’s specific objectives.
This commentary is not intended to constitute legal, tax, securities or investment advice or a recommended course of action in any given situation. Investors should not assume that investments in any security, asset class, sector, market, or strategy discussed herein will be profitable and no representations are made that clients will be able to achieve a certain level of performance, or avoid loss.
All investments carry a certain risk and there is no assurance that an investment will provide positive performance over any period of time. Information obtained from third party resources are believed to be reliable but not guaranteed as to its accuracy or reliability. These materials do not purport to contain all the relevant information that investors may wish to consider in making investment decisions and is not intended to be a substitute for exercising independent judgment. Any statements regarding future events constitute only subjective views or beliefs, are not guarantees or projections of performance, should not be relied on, are subject to change due to a variety of factors, including fluctuating market conditions, and involve inherent risks and uncertainties, both general and specific, many of which cannot be predicted or quantified and are beyond our control. Future results could differ materially and no assurance is given that these statements or assumptions are now or will prove to be accurate or complete in any way.
Past performance is not a guarantee or a reliable indicator of future results. Investing in the markets is subject to certain risks including market, interest rate, issuer, credit and inflation risk; investments may be worth more or less than the original cost when redeemed.
Investment advisory services are offered through Dynamic Advisor Solutions, LLC, dba Dynamic Wealth Advisors, an SEC registered investment advisor.