Bond Market Update: Sticky Inflation Tempers Easing Expectations
April 30, 2024
Download the 4.30.24 Dynamic Bond Market Update for advisors’ use with clients
By Bill Smith, Fixed Income Trader and Portfolio Manager
Yields continued to trend higher in April after a series of higher-than-expected inflation data pushed rate cut expectations deeper into the last half of 2024. Fed Chair Jerome Powell seemed to confirm this shift in sentiment during a panel discussion last Tuesday when he commented that “recent data have clearly not given us greater confidence” that inflation is coming fully under control and “instead indicate that it’s likely to take longer than expected to achieve that confidence.” While this uncertainty will likely lead to further volatility in the fixed income markets, it should also present income investors with additional opportunities to add yield to their portfolios. The chart below, “Yield to Worst,” summarizes the current yield of select ICE BofA indexes, broken out by maturity band.
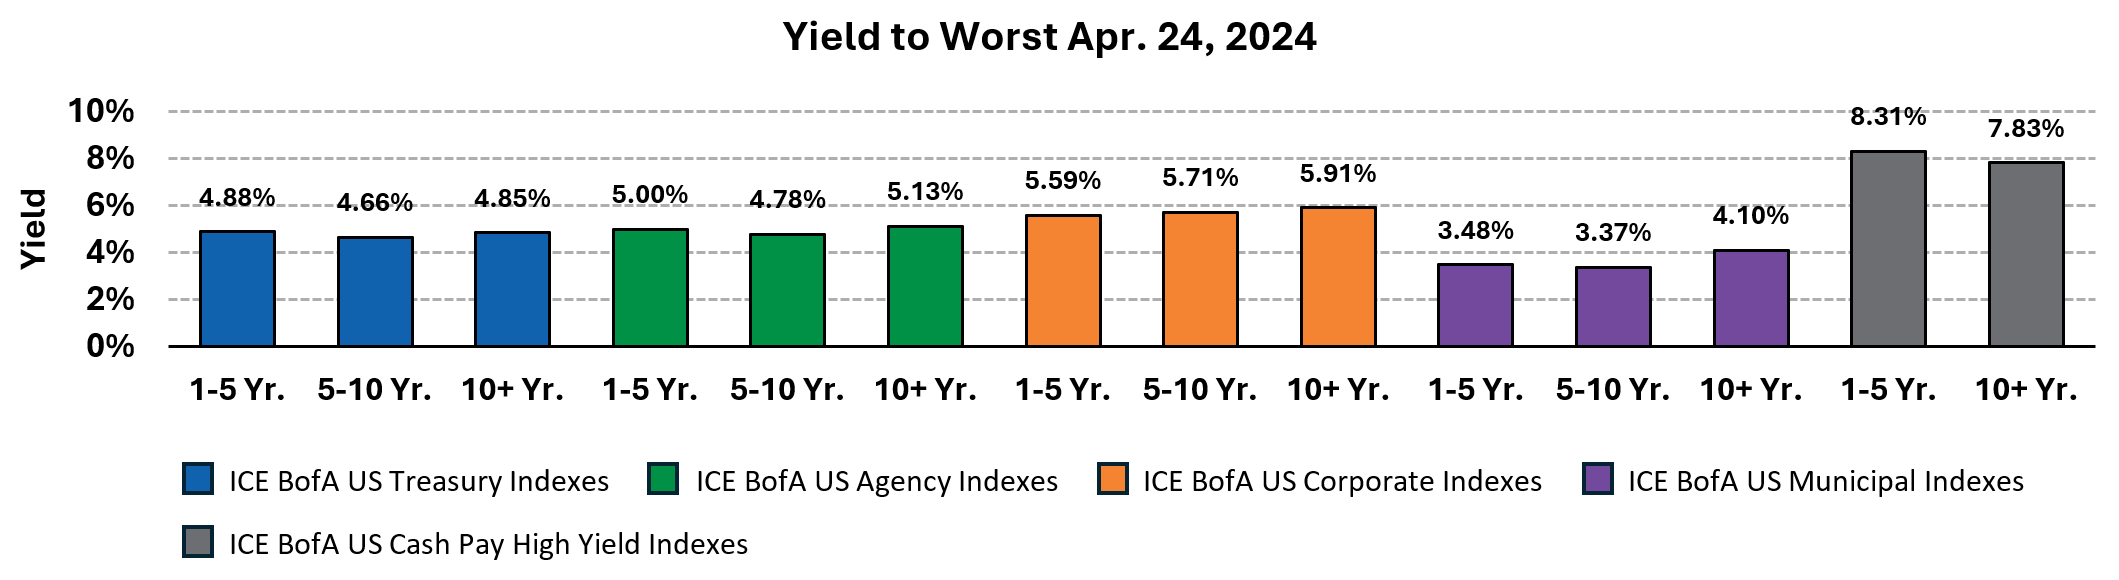
Source: Bloomberg. Past performance is no guarantee of future results.
Upside/Downside – A Look at Positive Convexity
In general, bond prices move inversely with yields, meaning bond prices go up as rates decline and fall when rates rise. To help quantify this relationship, investors often turn to modified duration, a formula that estimates the expected change in a bond’s price for a 1% shift in yield. For example, the price of a bond with a duration of six would increase by 6% for every 1% drop in yield. Conversely, that same bond would decline by 6% for a 1% increase in yield. While duration can help estimate a bond’s price when yield moves are small, its accuracy degrades as yield shifts become more pronounced. This is because bond prices do not move linearly, as modified duration would suggest, but instead follow a curved (convex) path. The chart below, “Actual vs. Estimated Price Change,” helps to illustrate this point by examining the price of a 30-year Treasury at different yield levels.
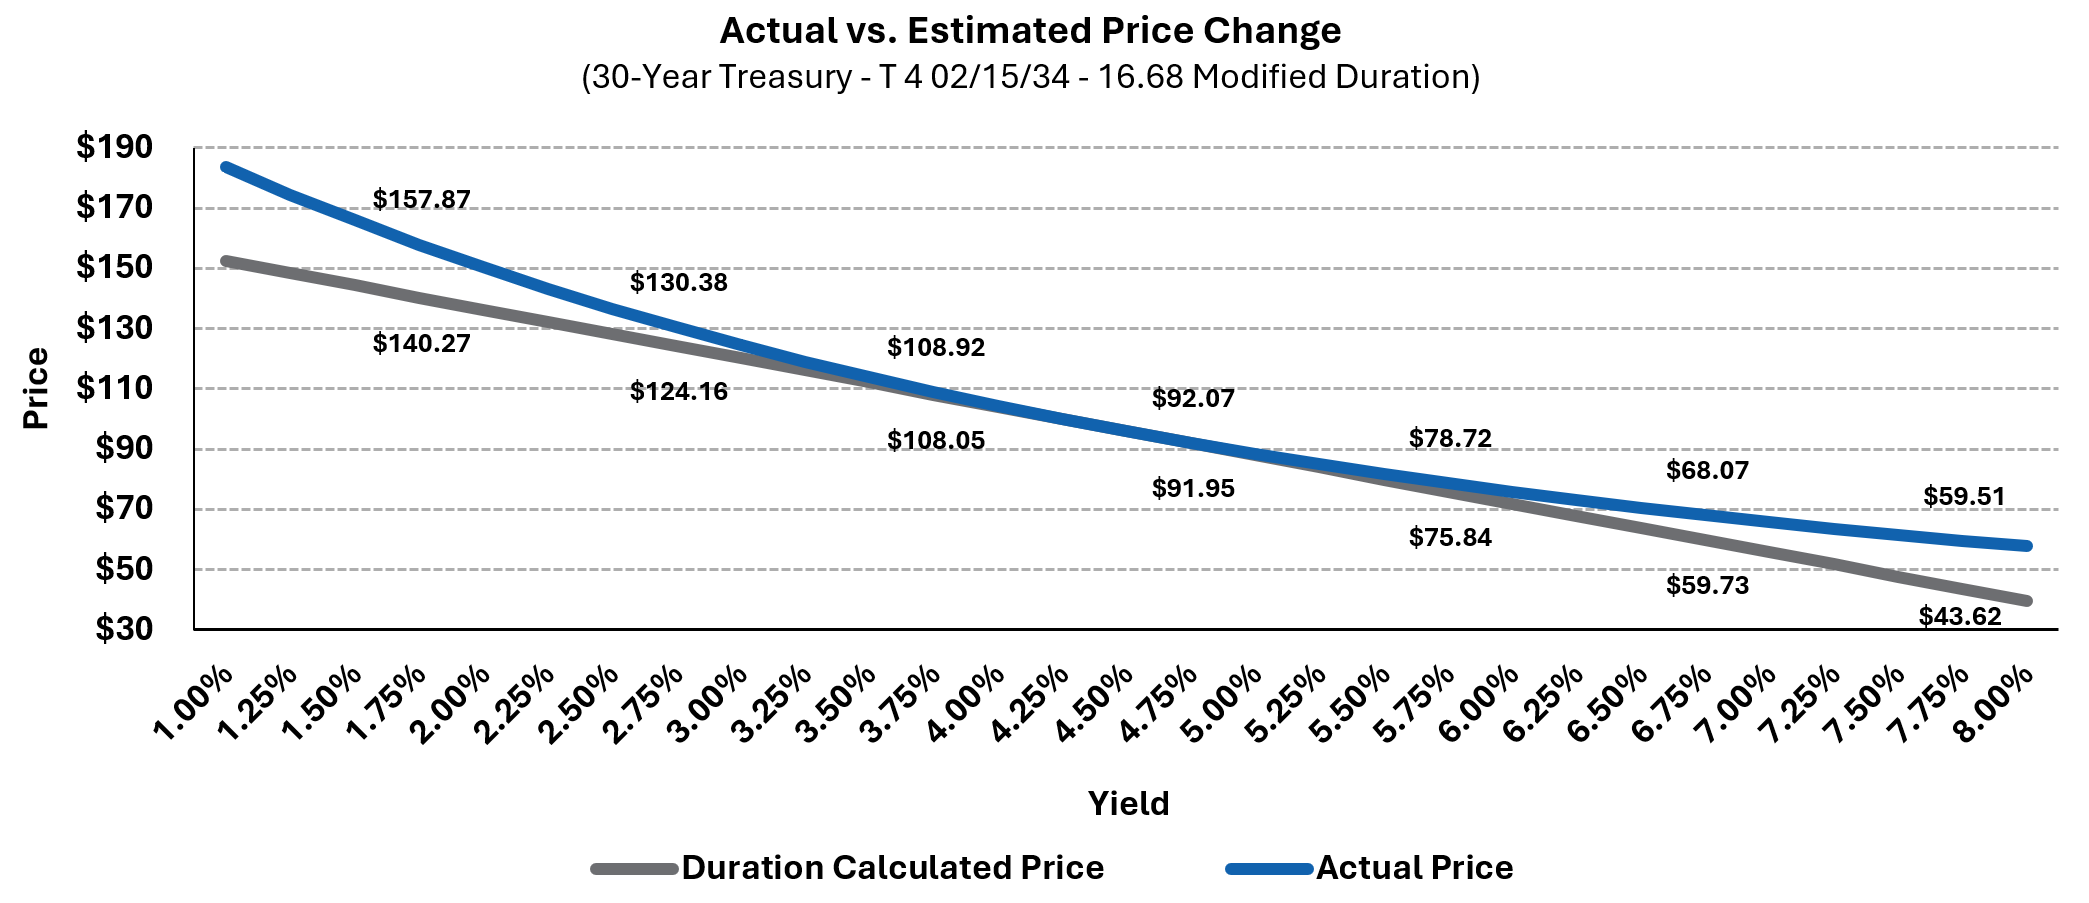
Source: Bloomberg (YA Function). Past performance is no guarantee of future results. Estimated and actual price changes are hypothetical.
As illustrated, when yield shifts are large, duration underestimates the upside and overestimates the downside. Since duration changes as yields change, actual prices tend to “curve away” from the price predicted by modified duration. The extent of this curvature, known as convexity, has important implications for fixed income investors. For positively convex bonds, such as non-callable securities that can’t be redeemed before maturity, duration increases as yields drop and decreases as yields rise. This means that in a falling rate environment, when bond prices are expected to increase, these bonds become more sensitive to interest rates. In rising rate environments, when bond prices are expected to fall, they become less sensitive to interest rates. Put simply, bonds that exhibit positive convexity should increase in price at a faster pace than they fall. It is crucial to note that not all bonds follow this relationship. Callable bonds, where an issuer has the right to redeem a security prior to maturity, as well as mortgage bonds and preferred securities often exhibit negative convexity. As yields decline and call risk increases, capital appreciation potential for negatively convex bonds is greatly reduced.
Putting it All Together – Higher Yields + Positive Convexity
Yields are currently near YTD highs and are at levels rarely seen in the last two decades. This presents investors with compelling income opportunities while also providing additional portfolio ballast should fixed income volatility continue. The higher the yield, the larger the price drawdown needed to offset that yield. Furthermore, as mentioned earlier, prices for bonds with positive convexity (think non-callable) will rise more as yields decline than they drop for similar upward shifts in yield. The table below, “Upside/Downside Total Return Analysis,” provides a clear illustration of this point. It compares the total return potential for various Treasuries under different interest rate scenarios, as estimated by Bloomberg’s convexity function. A 10-year Treasury, for example, has an estimated one-year total return of over 11% if interest rates decline by 1%. A similar move higher in rates, however, would only result in an unrealized loss of less than 2%.
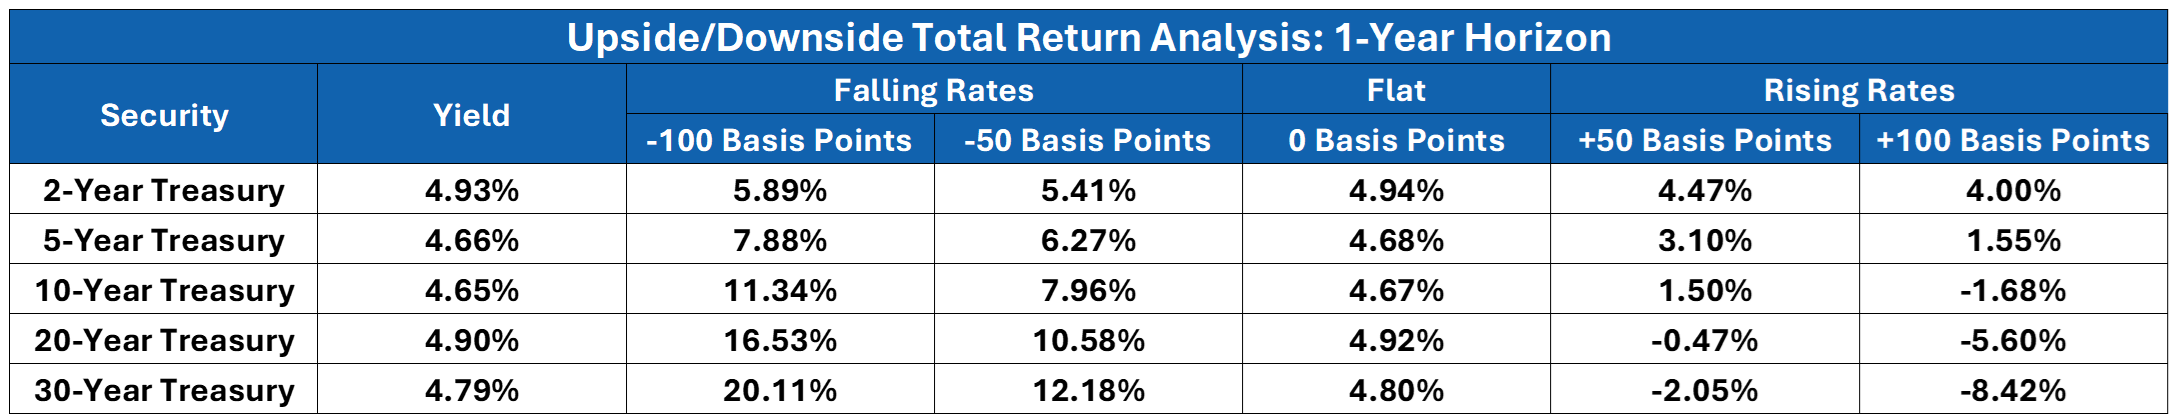
Source: Bloomberg (CVXA Function). 2-Year Treasury: T 4 ⅞ 04/30/26, 5-Year Treasury: T 4 ⅛ 03/31/29, 10-Year Treasury: T 4 02/15/34, 20-Year Treasury: T 4 ½ 02/15/44, 30-year Treasury: T 4 ¼ 02/15/54. Treasury yields as of 04/24/2024. Past performance is no guarantee of future results. Total return estimates are hypothetical.
With rate uncertainty expected to continue, convexity should be an important consideration when structuring a bond portfolio. Duration alone provides an incomplete picture of interest rate risk and may very well understate total return potential should we see lower rates in the second half of the year.
A prudent approach to fixed income investing calls for diversification across both credit and duration exposure. As always, Dynamic recommends staying balanced, diversified and invested. Despite short-term market pullbacks, it’s more important than ever to focus on the long-term, improving the chances for investors to reach their goals.
Should you need help navigating fixed income for your clients, please contact Dynamic’s Investment Management team at (877) 257-3840, ext. 4 or investmentmanagement@dynamicadvisorsolutions.com.
Bill Smith serves as president, Portfolio Management & Trading, of Harmont Fixed Income in Phoenix.
Disclosures
This commentary is provided for informational and educational purposes only. The information, analysis and opinions expressed herein reflect our judgment and opinions as of the date of writing and are subject to change at any time without notice. This is not intended to be used as a general guide to investing, or as a source of any specific recommendation, and it makes no implied or expressed recommendations concerning the manner in which clients’ accounts should or would be handled, as appropriate strategies depend on the client’s specific objectives.
This commentary is not intended to constitute legal, tax, securities or investment advice or a recommended course of action in any given situation. Investors should not assume that investments in any security, asset class, sector, market, or strategy discussed herein will be profitable and no representations are made that clients will be able to achieve a certain level of performance, or avoid loss.
All investments carry a certain risk and there is no assurance that an investment will provide positive performance over any period of time. Information obtained from third party resources are believed to be reliable but not guaranteed as to its accuracy or reliability. These materials do not purport to contain all the relevant information that investors may wish to consider in making investment decisions and is not intended to be a substitute for exercising independent judgment. Any statements regarding future events constitute only subjective views or beliefs, are not guarantees or projections of performance, should not be relied on, are subject to change due to a variety of factors, including fluctuating market conditions, and involve inherent risks and uncertainties, both general and specific, many of which cannot be predicted or quantified and are beyond our control. Future results could differ materially and no assurance is given that these statements or assumptions are now or will prove to be accurate or complete in any way. Past performance is not a guarantee or a reliable indicator of future results. Investing in the markets is subject to certain risks including market, interest rate, issuer, credit and inflation risk; investments may be worth more or less than the original cost when redeemed.
Investment advisory services are offered through Dynamic Advisor Solutions, LLC, dba Dynamic Wealth Advisors, an SEC registered investment advisor.
Photo: Adobe Stock