

Download the 6.7.24 Dynamic Market Update for advisors’ use with clients
By Kostya Etus, CFA®, Chief Investment Officer, Dynamic Investment Management
Where is the Volatility?
The market weakness of April–S&P 500 was down over 4%–was quickly forgotten as the market rebounded quickly in May with a gain of nearly 5%. This puts the year-to-date return for the S&P 500 at close to 11% through the end of May. This may be a surprise for many given what we have seen in the news:
- Persistent inflation: On a year-over-year basis, inflation remained unchanged at 2.7% in April according to the latest Personal Consumption Expenditure (PCE) inflation report from the Commerce Department. Likewise, the Federal Reserve’s (Fed) preferred measure of Core PCE that excludes energy and food also remains unchanged at 2.8% year-over-year. What we need to see is for these figures to inch closer to the Fed target of 2% inflation before interest rate cuts materialize.
- Interest rate cut delays: To start out the year, market expectations were calibrated towards six potential interest rate cuts in 2024 (0.25% each), with cuts starting as early as the second quarter. Given the sticky inflation readings, the expectations are now down to two cuts, starting potentially in September.
- Geopolitical tensions around the globe: Escalations in the Middle East, the ongoing Russia-Ukraine conflict, and increased U.S.-China strategic competition–to name a few–are more than enough to keep markets agitated.
Yet the market is resilient this year; not only that, but there are a few factors that make this market truly unique:
- Low Volatility: The CBOE Volatility Index (VIX) is a preferred measure for market volatility. So far in 2024, we have had the lowest average closing price for this index since 2017. In fact, we have only seen one daily price move of more than 2%, and it was an up day.
- Low Pullbacks: Corrections—pullbacks–are a normal part of the stock market, yet the largest peak-to-trough drop we have seen this year is only 5.5%. That is a fairly rare occurrence in the context of market history.
- Low Losses: The majority of asset classes are in the green this year. According to BlackRock, 78 out of 124 mutual fund categories are positive so far this year. This is a testament to how broad the market performance has been this year.
Overall, the economy remains on stable footing, we have a strong labor market and corporate earnings continue to beat expectations. This all bodes well for a continuation of a healthy market.
Sell in May and Go Away?
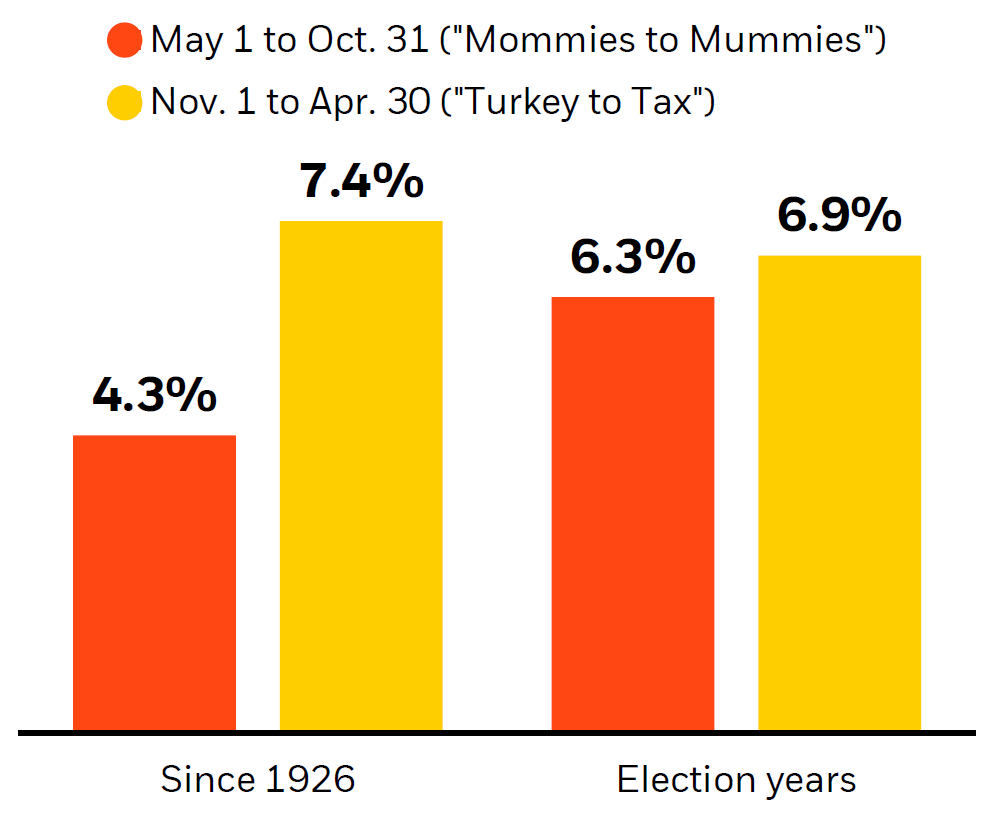
There is an old stock market adage “sell in May and go away,” which suggests that returns tend to be weaker in the summer months and rebound in the winter. Certainly, it would not have paid to “go away” this May, but what has history shown us? Let’s review the findings in the chart below which shows historic market performance going back to 1926:
- Mommies to Mummies: The six-month period from May 1 to October 31–approximately Mother’s Day to Halloween–has historically had weaker returns. While the stock market may be calmer during the summer months as investors relax, a 4.3% return over a 6-month period is nothing to scoff at–and would certainly be better than sitting in cash.
- Turkey to Tax: As the temperatures come down, the stock market tends to go up. The period from November 1 to April 30–approximately Thanksgiving to tax Season–tends to be stronger. Much of this may be attributable to the seasonally strong holiday months as consumers tend to spend more on gifts as well as participate in discount events such as Black Friday.
- Election Years: Interestingly, the outcomes tend to narrow during election years, such as the one we are in now. Election years tend to be stronger overall as presidents may boost fiscal policies to support the economy and labor markets.
That all said, the historic returns in the graphic point to an even better adage: “it’s not about timing the market, but about time in the market.” Staying invested and diversified is the best way to reach long-term investment goals.
Stay diversified, my friends.
Stock Market Performance: May-Oct vs. Nov-April
(Average for all 6-month periods from 1/1/1926 to 4/30/2024)
Source: BlackRock: Student of the Market, May 2024 Edition. Morningstar as of 4/30/24. U.S. stocks are represented by the S&P 500 TR Index from 3/4/57 to 4/30/24 and the IA SBBI U.S. Lrg Stock TR USD Index from 1/1/26 to 3/4/57. Past performance does not guarantee or indicate future results. Index performance is for illustrative purposes only. You cannot invest directly in the index.
As always, Dynamic recommends staying balanced, diversified and invested. Despite short-term market pullbacks, it’s more important than ever to focus on the long-term, improving the chances for investors to reach their goals.
Should you need help navigating client concerns, don’t hesitate to reach out to Dynamic’s Investment Management team at (877) 257-3840, ext. 4 or investmentmanagement@dynamicadvisorsolutions.com.
Disclosures
This commentary is provided for informational and educational purposes only. The information, analysis and opinions expressed herein reflect our judgment and opinions as of the date of writing and are subject to change at any time without notice. This is not intended to be used as a general guide to investing, or as a source of any specific recommendation, and it makes no implied or expressed recommendations concerning the manner in which clients’ accounts should or would be handled, as appropriate strategies depend on the client’s specific objectives.
This commentary is not intended to constitute legal, tax, securities or investment advice or a recommended course of action in any given situation. Investors should not assume that investments in any security, asset class, sector, market, or strategy discussed herein will be profitable and no representations are made that clients will be able to achieve a certain level of performance, or avoid loss.
All investments carry a certain risk and there is no assurance that an investment will provide positive performance over any period of time. Information obtained from third party resources are believed to be reliable but not guaranteed as to its accuracy or reliability. These materials do not purport to contain all the relevant information that investors may wish to consider in making investment decisions and is not intended to be a substitute for exercising independent judgment. Any statements regarding future events constitute only subjective views or beliefs, are not guarantees or projections of performance, should not be relied on, are subject to change due to a variety of factors, including fluctuating market conditions, and involve inherent risks and uncertainties, both general and specific, many of which cannot be predicted or quantified and are beyond our control. Future results could differ materially and no assurance is given that these statements or assumptions are now or will prove to be accurate or complete in any way.
Past performance is not a guarantee or a reliable indicator of future results. Investing in the markets is subject to certain risks including market, interest rate, issuer, credit and inflation risk; investments may be worth more or less than the original cost when redeemed.
Investment advisory services are offered through Dynamic Advisor Solutions, LLC, dba Dynamic Wealth Advisors, an SEC registered investment advisor.
Photo: Adobe Stock