

By Kostya Etus, CFA®, Head of Strategy, Dynamic Investment Management
Download the 9.16.22 Dynamic Quarterly Market Update for advisors’ use with clients
“Winning that ticket, Rose, was the best thing that ever happened to me… it brought me to you. And I’m thankful for that, Rose. I’m thankful. You must do me this honor. Promise me you’ll survive. That you won’t give up, no matter what happens, no matter how hopeless. Promise me now, Rose, and never let go of that promise.”
– Jack Dawson (Leonardo DiCaprio), “Titanic,” 1997
Volatility has persisted in both the stock and bond markets throughout the year in the face of high inflation, rising interest rates, supply problems, recession fear, and the continuation of the Ukraine conflict, to name a few.
But with a view to the future, many of these negative scenarios have already been priced into the market and any improvements, even incrementally, should result in favorable market reactions. Coupled with a strong labor market and resilient consumer spending, we can certainly see the light at the end of the tunnel.
That said, volatile market environments can lead to bad investment decisions if we lose focus of our long-term investment goals. In this quarterly market update, we review three reasons it’s beneficial to have a long-term view when it comes to investing.
Key Takeaways:
- During periods of high volatility, it’s important to remember that the market can have significant drawdowns in any given year, however, the end result is typically a positive annual gain.
- Just like market corrections, recessions happen regularly, but are overshadowed by the overwhelming length and strength of historic expansions.
- Whether investing in stocks or bonds, the longer an investor stays in the market, the higher the probability of a positive return.
Large Market Drops are Common, but Yearly Returns are Often Positive
The train that’s generally moving up a mountain needs to let out some steam now and again to prevent more serious problems. Going into 2022, the market may have been overheating from strong performance post-Covid and is now releasing some of that pressure by coming down to more stable levels. As such:
- Market drops are normal: As a gentle reminder, the S&P 500 was up 31% in 2019, 18% in 2020 and 29% in 2021. Historically, a market drop of 10% happens just about every year and a drop of 20% happens about every six years. Investors sometimes get comfortable in the good times and forget to expect a bit of market turbulence now and then on their way up the mountain.
- Markets are cyclical: Market performance is often overexaggerated on the upside due to excessive expectations and is then overly disappointed as it reverses course. This is why the market is volatile and doesn’t simply move in a straight line. The post-Covid exuberance may have been overdone in 2021, but recent market performance may certainly lead you to believe very unfavorable outcomes in 2022. Meaning that the market is already pricing in high inflation, high rates, low growth, high food and energy prices, continued geopolitical conflict, Covid driven supply-chain issues, etc. Any potentially favorable news, or even “less bad” news may shift the tide back to the upside. Historically, after a market decline of more than 10%, the forward looking one, three, and five-year returns are all close to or above positive double-digit growth.
- Market drops don’t translate to calendar year losses: Looking at the chart below, “S&P 500 Market Declines in Perspective: Even Up Markets See Drawdowns,” you’ll notice that in any given year there is a market drop at some point within that year. These losses can be significant—see the 30% drop in 1987, 27% drop in 2009 and 34% drop in 2020. What do they all have in common? The calendar year return for all those years were positive. Moving out of the market in any one of those years could have led investors to miss out on significant returns. Historically, while losses do happen as a normal part of the market, the market tends to trend upward over time and most years it ends up on the positive side.
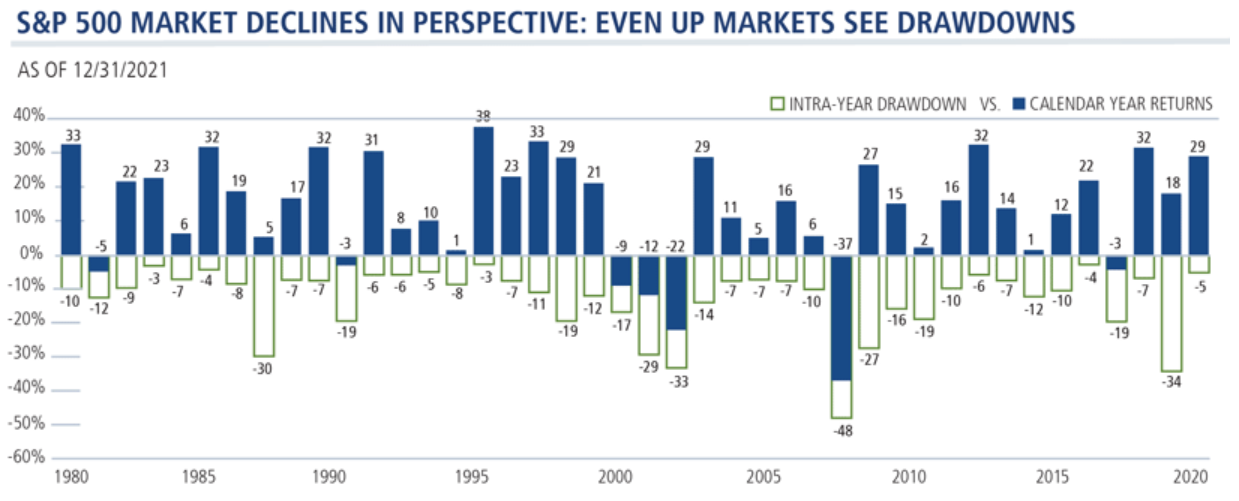
Source: Calamos Investments. Morningstar using daily total return data. The S&P 500 Index is generally considered representative of the U.S. stock market. Past performance is no guarantee of future results.
Recessions are Painful, But Expansions Have Been Powerful
Persistent high inflation and aggressive rate hikes from the Federal Reserve (Fed) are certainly headwinds for the economy, and some investors believe that the U.S. is already in a recession. However, there are a few things to consider:
- Are we in a recession? The National Bureau of Economic Research (NBER), which officially declares recessions, defines a recession as “a significant decline in economic activity spread across the economy, lasting more than a few months, normally visible in real GDP, real income, employment, industrial production and wholesale-retail sales.” Well, industrial production has been up this year and the job market is in great shape. And with consumer spending alive and well, as we head into the holiday season, it’s hard to believe that we would call for a recession.
- Could a recession still happen? All said, it doesn’t mean a recession is not on the horizon. One signal to watch for is the inversion of the three-month Treasury bill interest and the 10-year Treasury note rates. Typically, this inversion precedes a recession by 12 to 18 months. If the Fed continues its trajectory of raising rates, we could see this inversion before the end of the year, which could potentially signal for a recession in late 2023.
- What have historic recessions looked like? It’s important to remember that just like market corrections, recessions are a normal part of a growing economy and not something to be afraid of over the long term. Looking at the chart below, “Recessions are painful, but expansions have been powerful,” you can see that recessions do happen regularly but are overshadowed by the overwhelming length and strength of historic expansions. As you can see the average expansion lasts close to six years (69 months), while the average recession is less than a year. Similar to the stock market, the economy has a strong tendency to go up over the long term and it’s important to take a step back and look at the big picture.
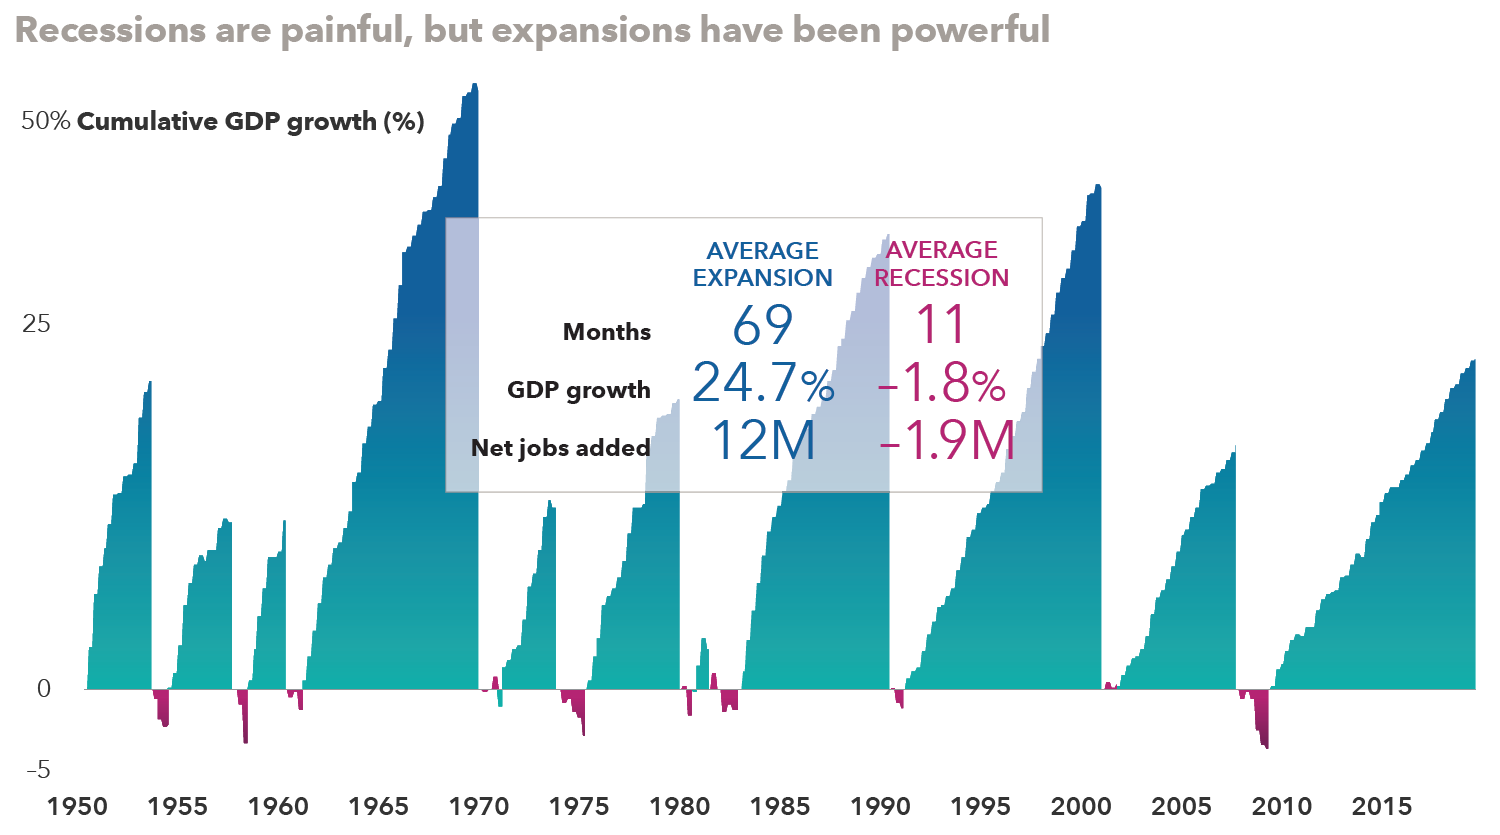
Source: Capital Group, National Bureau of Economic Research, Refinitiv Datastream. As of 12/31/19. Since NBER announces recession start and end months rather than exact dates, we have used month-end dates as a proxy for calculations of jobs added. Nearest quarter-end values used for GDP growth rates. GDP growth shown on a logarithmic scale. Past performance is no guarantee of future results.
Markets May Be Volatile in the Short Term, but Probabilities Favor Long Term Investors
The up and down movements in the stock market can vary greatly on a day-to-day basis, and can give the impression that the market is no more than a coin flip. Similarly, the drop in bond prices in 2022 has given investors pause about future prospects for using the asset class. But as we look out for longer time frames of returns, a unique trend starts to develop (see graph below, “Probability of Positive Returns for Stocks and Bonds for Various Holding Periods.”) A few key observations:
- Stocks are better than a coin flip. With data going back to 1925, we see that over a relatively short three-month rolling period, the probability of a positive return for the stock market is almost 70%. Oftentimes when investors look more frequently at their accounts (e.g., daily or weekly), they have a worse investor experience from an emotional standpoint because their performance is perceived to be more volatile. This can often lead to losing focus of long-term goals and making bad investing choices.
- Bonds have “almost” never had a negative three-year return. While the stock market is certainly better than a coin-flip over longer time periods, the bond market has the edge in more consistent and stable positive returns. Additionally, it’s important to note that the magnitude of losses is quite different. When we looked at one-year rolling data, for example, we found that the average stock market drop was close to -14% while the average bond market drop was less than -2%. So not only is the bond market up more frequently, but also the size of the losses is considerably lower.
- Whether investing in stocks or bonds, long-term investing is the key to success. Perhaps the most important concept that this graph relays is the benefit of long-term investing. The longer an investor stays in the market, the higher the probability of a positive return. Over a 10-year period, the probability of positive returns for both stocks and bonds is close to 100%.
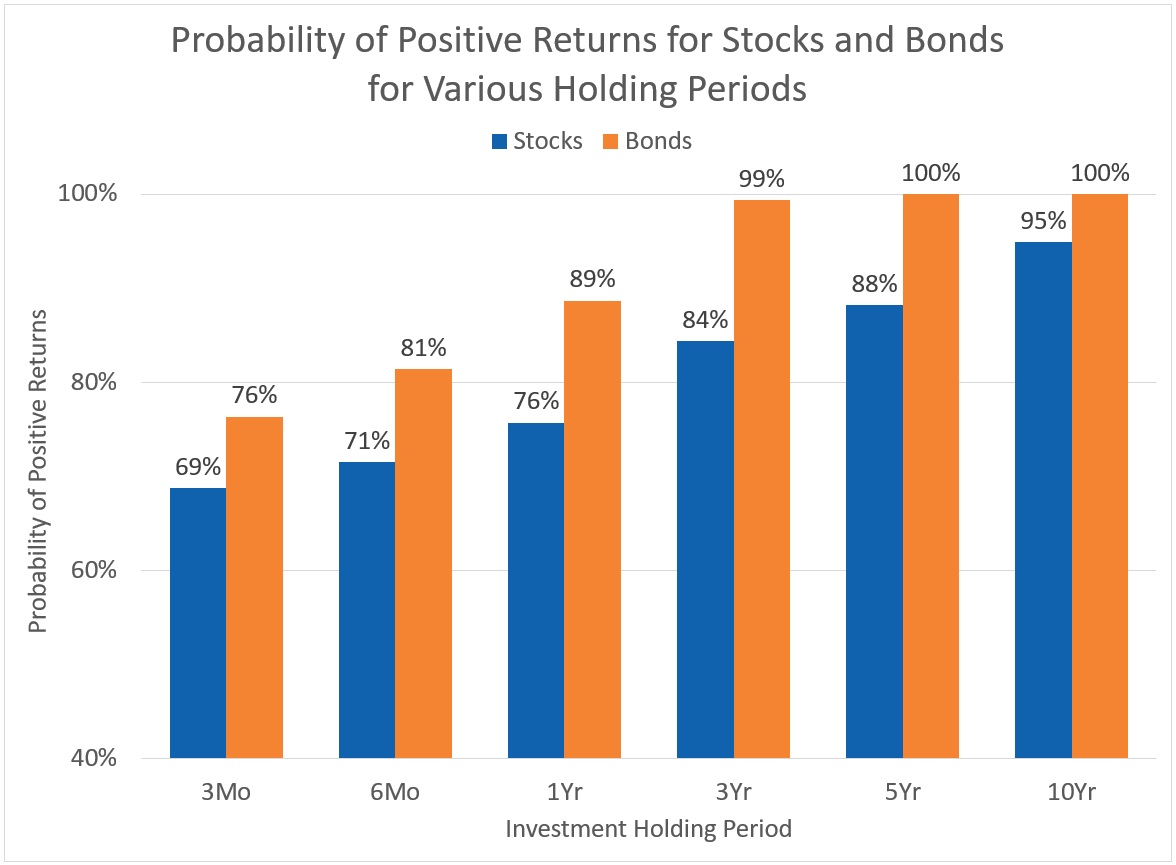
Source: Morningstar Direct utilizing IA SBBI US Large Stock TR USD Ext to represent Stocks and IA SBBI US IT Govt TR USD to represent Bonds between 12/31/1925 and 7/31/2022. Past performance is not indicative of future returns.
As always, Dynamic recommends staying balanced, diversified and invested. Despite short-term market pullbacks, it’s more important than ever to focus on the long-term, improving the chances for investors to reach their goals.
Should you need help navigating client concerns, don’t hesitate to reach out to Dynamic’s Investment Management team at (877) 257-3840, ext. 4 or investmentmanagement@dynamicadvisorsolutions.com.
Disclosures
This commentary is provided for informational and educational purposes only. The information, analysis and opinions expressed herein reflect our judgment and opinions as of the date of writing and are subject to change at any time without notice. This is not intended to be used as a general guide to investing, or as a source of any specific recommendation, and it makes no implied or expressed recommendations concerning the manner in which clients’ accounts should or would be handled, as appropriate strategies depend on the client’s specific objectives.
This commentary is not intended to constitute legal, tax, securities or investment advice or a recommended course of action in any given situation. Investors should not assume that investments in any security, asset class, sector, market, or strategy discussed herein will be profitable and no representations are made that clients will be able to achieve a certain level of performance, or avoid loss.
All investments carry a certain risk and there is no assurance that an investment will provide positive performance over any period of time. Information obtained from third party resources are believed to be reliable but not guaranteed as to its accuracy or reliability. These materials do not purport to contain all the relevant information that investors may wish to consider in making investment decisions and is not intended to be a substitute for exercising independent judgment. Any statements regarding future events constitute only subjective views or beliefs, are not guarantees or projections of performance, should not be relied on, are subject to change due to a variety of factors, including fluctuating market conditions, and involve inherent risks and uncertainties, both general and specific, many of which cannot be predicted or quantified and are beyond our control. Future results could differ materially and no assurance is given that these statements or assumptions are now or will prove to be accurate or complete in any way.
Past performance is not a guarantee or a reliable indicator of future results. Investing in the markets is subject to certain risks including market, interest rate, issuer, credit and inflation risk; investments may be worth more or less than the original cost when redeemed.
Investment advisory services are offered through Dynamic Advisor Solutions, LLC, dba Dynamic Wealth Advisors, an SEC registered investment advisor.
Photo: Simon Berger, Unsplash