

By Kostya Etus, CFA®
Chief Investment Officer, Dynamic Investment Management
Download the Q3 2023 Investing Insights for advisors’ use with clients
“When life gets you down, you know what you gotta do? Just keep swimming.”
– Dory (Ellen DeGeneres), “Finding Nemo,” 2003
It may be hard to believe, but the stock market has performed great this year! It’s especially hard to believe if you’d read any financial news website on any given day this year: possibility of a recession, a banking crisis, interest rate hikes, sticky inflation, softening economy, debt ceiling, U.S. credit downgrade…and the list goes on. But the market is resilient and looking to the future.
Markets have benefitted from three key factors:
- Decreased expectations of a recession (at least a severe one). This is supported by continued strength in Gross Domestic Product (GDP) growth (2.4% in Q2) and a resilient job market.
- Strong corporate earnings, which are beating expectations—a sign of confidence in consumer spending.
- Increased expectations that there won’t be additional interest rate hikes. Market expectations are pointing to stabilization for rates through the end of the year and rate cuts potentially starting in early 2024.
Looking forward as economic growth remains resilient, inflation continues to moderate, consumer spending stays strong and the potential of lower interest rates in the future—we have several tailwinds supporting healthy stock and bond markets.
Key Takeaways:
- Stock prices are based on expected earnings, and we’ve seen earnings go up for the last 100 years; the next 100 should be no different.
- Fear can lead to emotional decisions and irrational behaviors for investors in the short-term, but the long-term trend shows consistent growth.
- The 60/40 is certainly not dead and has been making a comeback in 2023, and could continue to do so in the second half of the year.
Everything is Cyclical
How does the stock market work? A stock’s price is indicative of the current value of a company. A company’s value is determined by how much earnings it is expected to generate. Thus, a stock price is representative of how much an investor is willing to pay for a share of earnings.
Earnings, just like anything else related to investing, are cyclical. This means that over shorter time periods there may drops below the historic average, but the overall trend is consistently positive. This is clearly depicted in the graph below, “S&P 500 Earnings Per Share,” dating back to 1927:
- Earnings are Cyclical: Notice how earnings dropped below the trendline during Covid in 2020, but then quickly rebounded through 2021. Next, they retreated again in 2022…a pattern is emerging.
- Trend is Upward: Despite the short-term ups and downs, looking all the way back to 1927, we see a nice upward trend over the long-term. In fact, the growth rate over this nearly 100-year period is more than 5% per year.
- Focus on Long-Term: It should come as no surprise that stock prices tend to follow similar patterns as earnings. We have seen earnings go up for the last hundred years, and the next hundred should be no different. And you can expect stock prices to follow suit.
S&P 500 Earnings Per Share
(1927 – 2022)
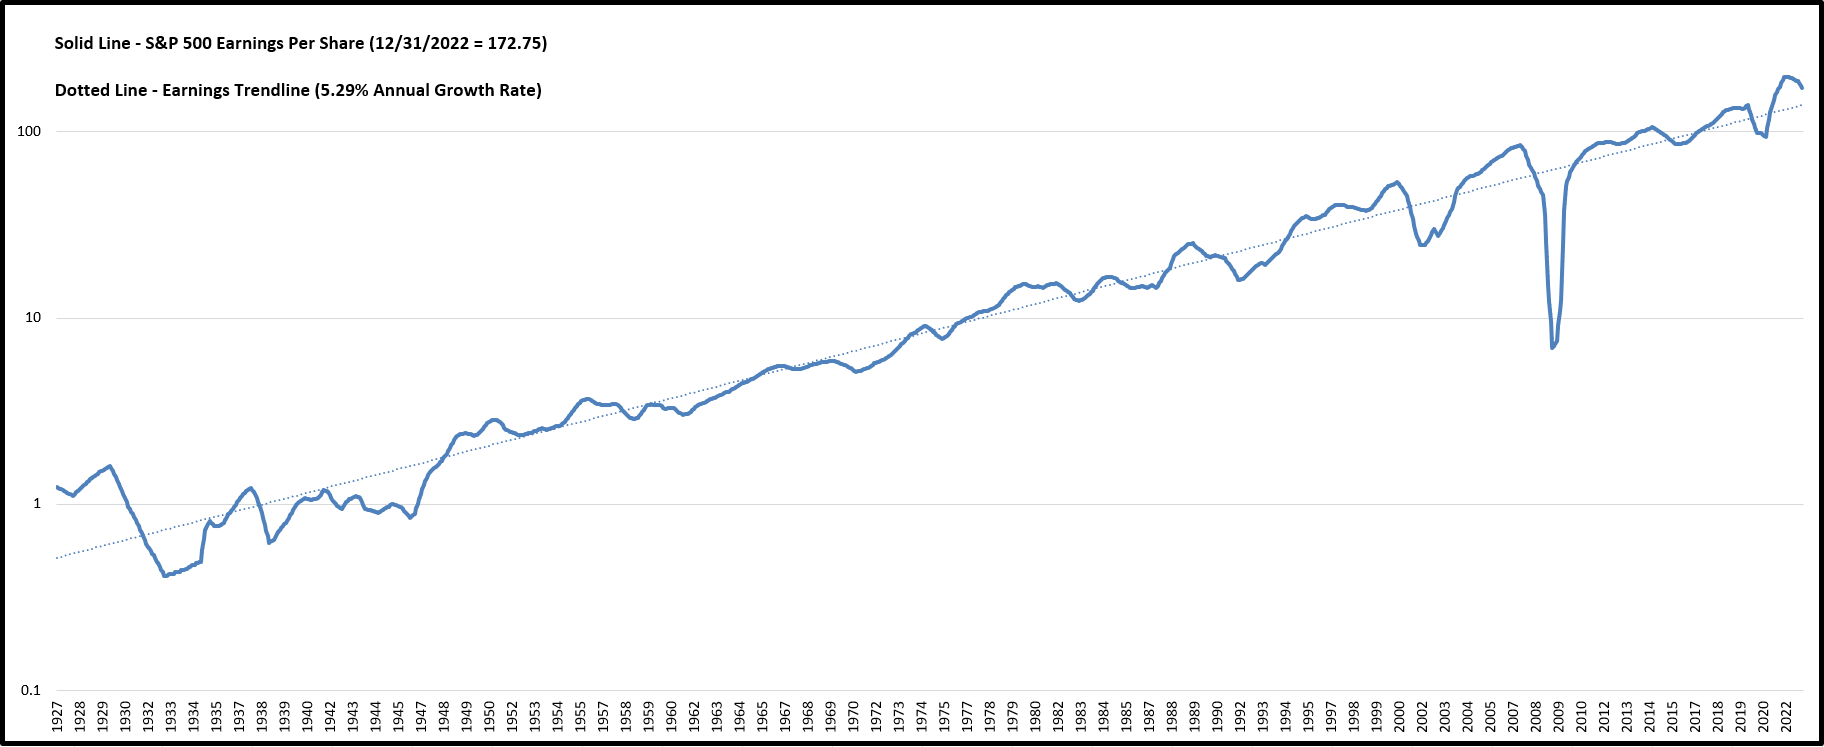
Source: GuruFocus. www.gurufocus.com As of 12/31/2022. Past performance is no guarantee of future results.
Market Resilience
A famous Benjamin Graham quote reads: “In the short run, the market is a voting machine but in the long run it is a weighing machine.” What Graham was trying to relay is that in the short-term, there is often market turmoil driven by news headlines and fear. But in the long-term, the market is driven by fundamentals (how profitable companies are).
The chart below, “Performance of U.S. Stock Market and Crisis Events,” dates back to 1936. While these events were certainly painful when they happened, how impactful were they to long-term market performance? Taking a step back and looking at the long-term view paints a different picture:
- Investor Fear: Fear can lead to emotional decisions and irrational behaviors for investors, which often translates to increased volatility and potential market drops.
- Fundamentals: Companies grow their profits over time because consumers continue to spend more money as they earn more money. This relationship is unlikely to change any time soon.
- Long-Term Focus: Consumer spending, corporate profits and the stock market are intertwined. They may be cyclical in nature, but the long-term trend shows consistent growth.
Performance of U.S. Stock Market and Crisis Events
(S&P 500 Since 1936 – A History of Moving through Difficult Times)
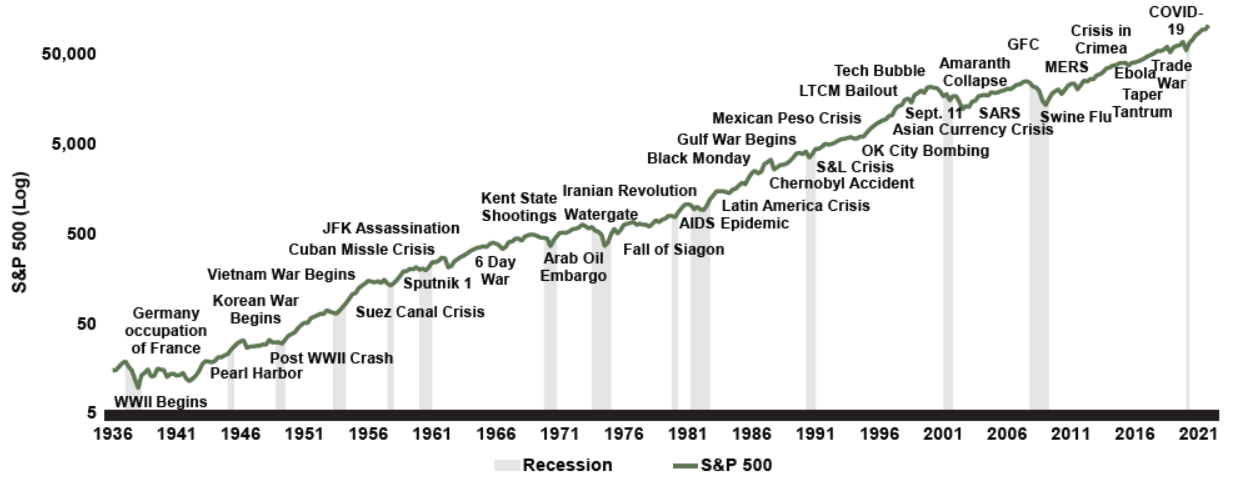
Source: St. Louis Fred & Morningstar Direct. S&P 500: Daily market return index as of 12/31/2021. Log: Lognormal Scale. Graph obtained from https://topforeignstocks.com/2022/07/21/performance-of-us-stock-market-and-crisis-events-since-1936/ Past performance is no guarantee of future results.
Balance and Diversification
The diversified 60% stock, 40% bond portfolio (the “60/40”) is certainly not dead and has been making a comeback in 2023, and could continue to do so in the second half of the year. First, 2022 was an extreme year where both stocks and bonds were down, and certainly not the norm. Second, bonds are finally yielding attractive rates and can provide a more dependable return, particularly with stabilization in Fed rate hikes. And third, valuations for stocks are more attractive than they were going into 2022.
To help illustrate the benefits of staying balanced and diversified, the table below shows performance of three popular investment strategies:
- Buy the Dip: This strategy represents buying the prior year’s worst performing asset class every year. While this is often a popular strategy with “deep value” investors, it may be susceptible to buying assets after a big drop that continue to fall—often referred to with an expression, “catching a falling knife.”
- Ride the Wave: This strategy represents buying the prior year’s best performing asset class every year. Chasing performance is rarely the best answer and, as the graph shows, this strategy would have lost money over the 16-year period.
- Balanced Portfolio: This strategy represents maintaining a 60/40 split between U.S. large cap stocks (represented by the S&P 500 Index) and U.S. core bonds (represented by the Bloomberg U.S. Aggregate Index) with an annual rebalance. As you can see, a balanced portfolio approach would have outpaced the other strategies over the past 16 years.
Stay diversified, my friends.
Performance of 3 Top Investment Strategies
(2007-2022)
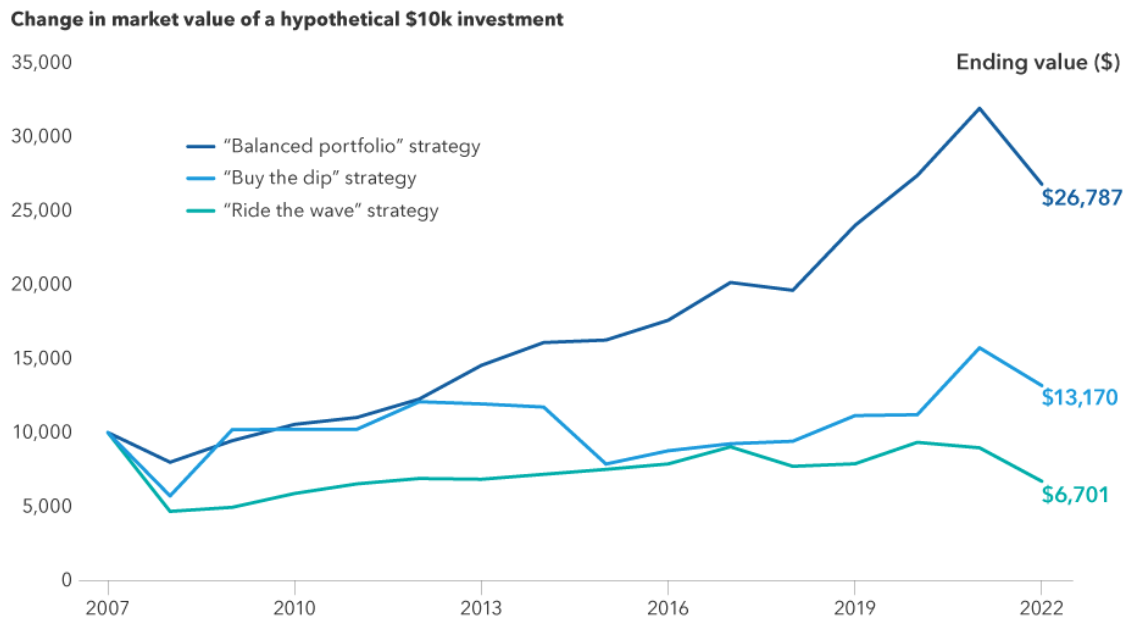
Sources: Capital Group, Bloomberg Index Services Ltd., FTSE Russell, ICE Benchmark Administration Ltd., MSCI, Refinitiv Datastream, Standard & Poor’s. Returns figures are as of December 31, 2022. Obtained from this article: https://www.capitalgroup.com/advisor/insights/articles/3-reasons-60-40-portfolios-comeback.html Past performance is no guarantee of future results.
As always, Dynamic recommends staying balanced, diversified and invested. Despite short-term market pullbacks, it’s more important than ever to focus on the long-term, improving the chances for investors to reach their goals.
Should you need help navigating client concerns, don’t hesitate to reach out to Dynamic’s Investment Management team at (877) 257-3840, ext. 4 or investmentmanagement@dynamicadvisorsolutions.com.
Disclosures
This commentary is provided for informational and educational purposes only. The information, analysis and opinions expressed herein reflect our judgment and opinions as of the date of writing and are subject to change at any time without notice. This is not intended to be used as a general guide to investing, or as a source of any specific recommendation, and it makes no implied or expressed recommendations concerning the manner in which clients’ accounts should or would be handled, as appropriate strategies depend on the client’s specific objectives.
This commentary is not intended to constitute legal, tax, securities or investment advice or a recommended course of action in any given situation. Investors should not assume that investments in any security, asset class, sector, market, or strategy discussed herein will be profitable and no representations are made that clients will be able to achieve a certain level of performance, or avoid loss.
All investments carry a certain risk and there is no assurance that an investment will provide positive performance over any period of time. Information obtained from third party resources are believed to be reliable but not guaranteed as to its accuracy or reliability. These materials do not purport to contain all the relevant information that investors may wish to consider in making investment decisions and is not intended to be a substitute for exercising independent judgment. Any statements regarding future events constitute only subjective views or beliefs, are not guarantees or projections of performance, should not be relied on, are subject to change due to a variety of factors, including fluctuating market conditions, and involve inherent risks and uncertainties, both general and specific, many of which cannot be predicted or quantified and are beyond our control. Future results could differ materially and no assurance is given that these statements or assumptions are now or will prove to be accurate or complete in any way.
Past performance is not a guarantee or a reliable indicator of future results. Investing in the markets is subject to certain risks including market, interest rate, issuer, credit and inflation risk; investments may be worth more or less than the original cost when redeemed.
Investment advisory services are offered through Dynamic Advisor Solutions, LLC, dba Dynamic Wealth Advisors, an SEC registered investment advisor.