

By Kostya Etus, CFA®, Head of Strategy, Portfolio Services Team
“You have to do everything you can, you have to work your hardest, and if you do, you have a shot at a silver lining.” – Pat/Bradley Cooper (“Silver Linings Playbook” 2012)
There are plenty of things to worry about these days, including global supply chain disruptions, COVID-19 resurgence, infrastructure and tax bills, inflation fears with soaring energy and housing prices, and looming Fed taper talks.
These things have led to fears around market volatility, rising interest rates and economic weakness. I would like to highlight some of the silver linings that exist within each of those concerns.
Key Takeaways:
- Market volatility feels like it’s at excessive levels, which has led to fear of a potential market top and likelihood of a correction. Evaluating the data shows that volatility is actually below historic averages.
- Rising rates are inevitable; it’s simply a matter of time. But it’s important to remember that rising rates typically coincide with improvements and stability of economic health.
- The Delta variant of COVID-19 resulted in a significant spike in cases and rose fears about additional shutdowns and business disruptions. The latest data suggests that the worst may be behind us.
Market volatility feels extreme…But is it, actually?
Market volatility is a perfectly natural, normal thing. As investors, we have all been spoiled by a long stretch of below average volatility between 2012 and 2020. That’s eight years of bliss! Then 2020 reminded us about the risk we had forgotten with a punch in the face, and we reverted to fearing the market like we did post-financial crisis of 2008. These wild mood swings aren’t healthy, and sometimes we need to look at the data to see where we have been, where we are now and where we may be headed.
One of the best gauges of market volatility is the VIX Index. The below graph shows the level of the VIX, dating to 2000, when we were in the midst of the technology bubble. There are three things to remember:
- While 2020 was clearly an extreme (similar to the tech bubble and global financial crisis), volatility has subsided in 2021, and we have spent most of the year under the average level of 20. Thus, volatility is actually “normal” by this definition.
- Volatility may feel elevated simply because it was closer to the 10 to 15 range for such a long period prior to 2020.
- Historically, volatility appears to trend down after peaks and persist at lower levels. The current environment would suggest that after peaking in early 2020, volatility has trended down to current, below average levels and may persist to stay there going forward.
Lastly, for more data support, we looked at average daily changes in the S&P 500 over the last three years. The average in 2019 was 0.58%, in 2020 it more than doubled to 1.35% and in 2021, it came back to a more normal 0.61%.
The data leads us to believe that the current market environment is normal in terms of volatility, and it doesn’t correlate with excessive fear of market stress or likelihood of a correction.
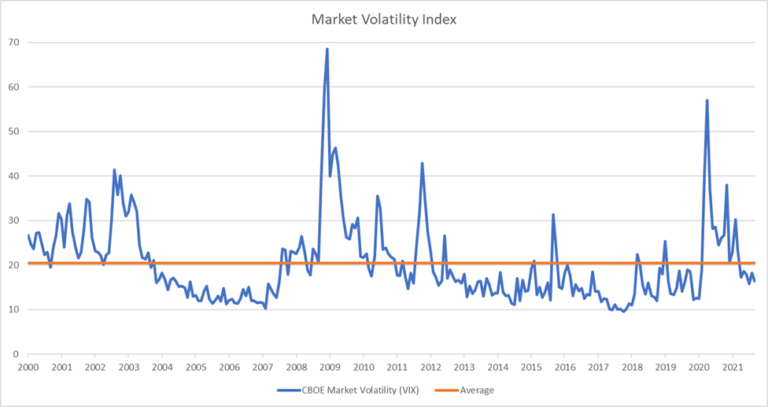
Source: VIX data and daily S&P 500 price changes, Morningstar Direct; VIX monthly data Jan. 2000-Sept. 2021; S&P500 daily data Jan. 2019-Sept. 2021
Interest rates vs. the economy…Is good news actually bad news?
Expectations for rising rates have increased recently, leading to some investor concerns. But are rising rates a bad thing?
First, let’s re-examine what actually drives interest rate changes:
- Supply and Demand: An increase in demand for money or credit, such as increased demand for house purchases, will generally raise interest rates. But an increase in the supply of money, for example an increase in the amount that banks can lend for home purchases, will reduce interest rates.
- Inflation: Higher inflation typically leads to an increase in longer-term interest rates as money lenders will want higher returns in anticipation of a decrease in purchasing power in the future.
- Federal Reserve (Fed): The Fed can adjust the federal funds rate, the overnight rate that banks charge each other, which in effect controls short-term rates. The Fed can influence rates by purchasing or selling treasuries in the open market, thereby affecting supply and demand.
Now, let’s think about how these forces relate to economic growth. Demand for money and loans to purchase new goods and services would generally be beneficial for the economy and companies. Inflation is typically driven by this same demand. If more people want something, it will drive up prices. Lastly, the Fed is mandated to keep prices stable (control inflation) and achieve maximum sustainable employment—core functions of a healthy economy.
Case in point, the chart below shows how the level of rates and economic growth tend to move in tandem over time.
The Fed will eventually raise rates; it’s inevitable, but also important to remember they will only raise rates if they see economic improvement and stability. Furthermore, Fed representatives have continually reinforced their commitment to a strategic, long-term process when raising rates to avoid market disruptions. It will be important for investors to keep this in mind to avoid potentially harmful knee-jerk reactions when it comes to their long-term investment portfolios.
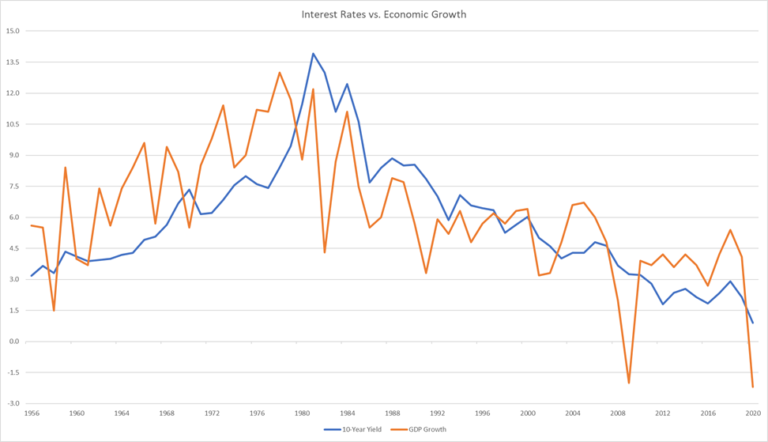 Source: FRED database, 1956-2020
The Delta variant spread quickly…Have we peaked?
The resurgence of COVID-19 through the more contagious Delta variant has been a top concern for both the economy and the markets. But as vaccinations have increased and outbreaks subsided, the worst may be behind us.
One good way to evaluate the status of COVID in the U.S. is to evaluate a seven-day moving average of daily confirmed cases as reported to the Centers for Disease Control and Prevention (CDC). The graph below shows the trend of cases since tracking began in early 2020. A few key observations include:
- Vaccinations started in March 2021, and you can see a downward move in cases to low levels by June.
- Next, the Delta variant spread started around July and cases reached a similar level to mid-November 2020, which was right before the “holiday spikes” kicked in.
- However, after a September 1 peak, it appears that cases have been trending down consistently and the seven-day average is now less than half of where it was at the peak.
It’s reassuring to see the rates drop like this as the cold weather starts to roll in. If the January peak was any indication, the decreased trend in cases should continue and there could be fewer disruptions for the holiday season. The holiday months are typically when consumer spending is highest, boosting economic growth and outlook for financial markets.
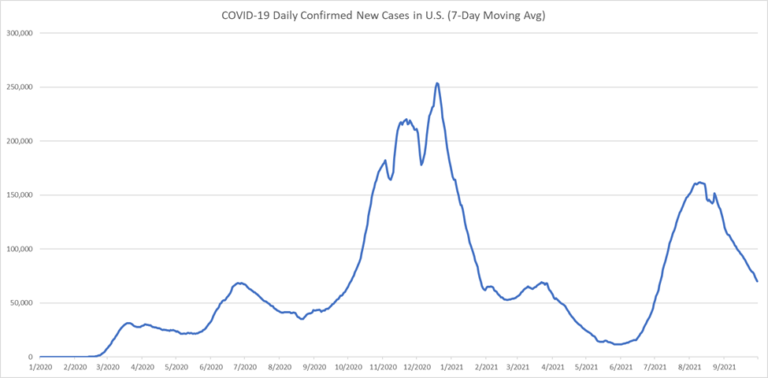 Source: Centers for Disease Control and Prevention (CDC) Covid Data Tracker Jan. 23, 2020-Oct. 22, 2021